API monitoring & analytics
simplified for Fiber
Tired of complex monitoring platforms? Apitally makes it easy to understand API usage, monitor performance, and troubleshoot issues. Just add a few lines of code.
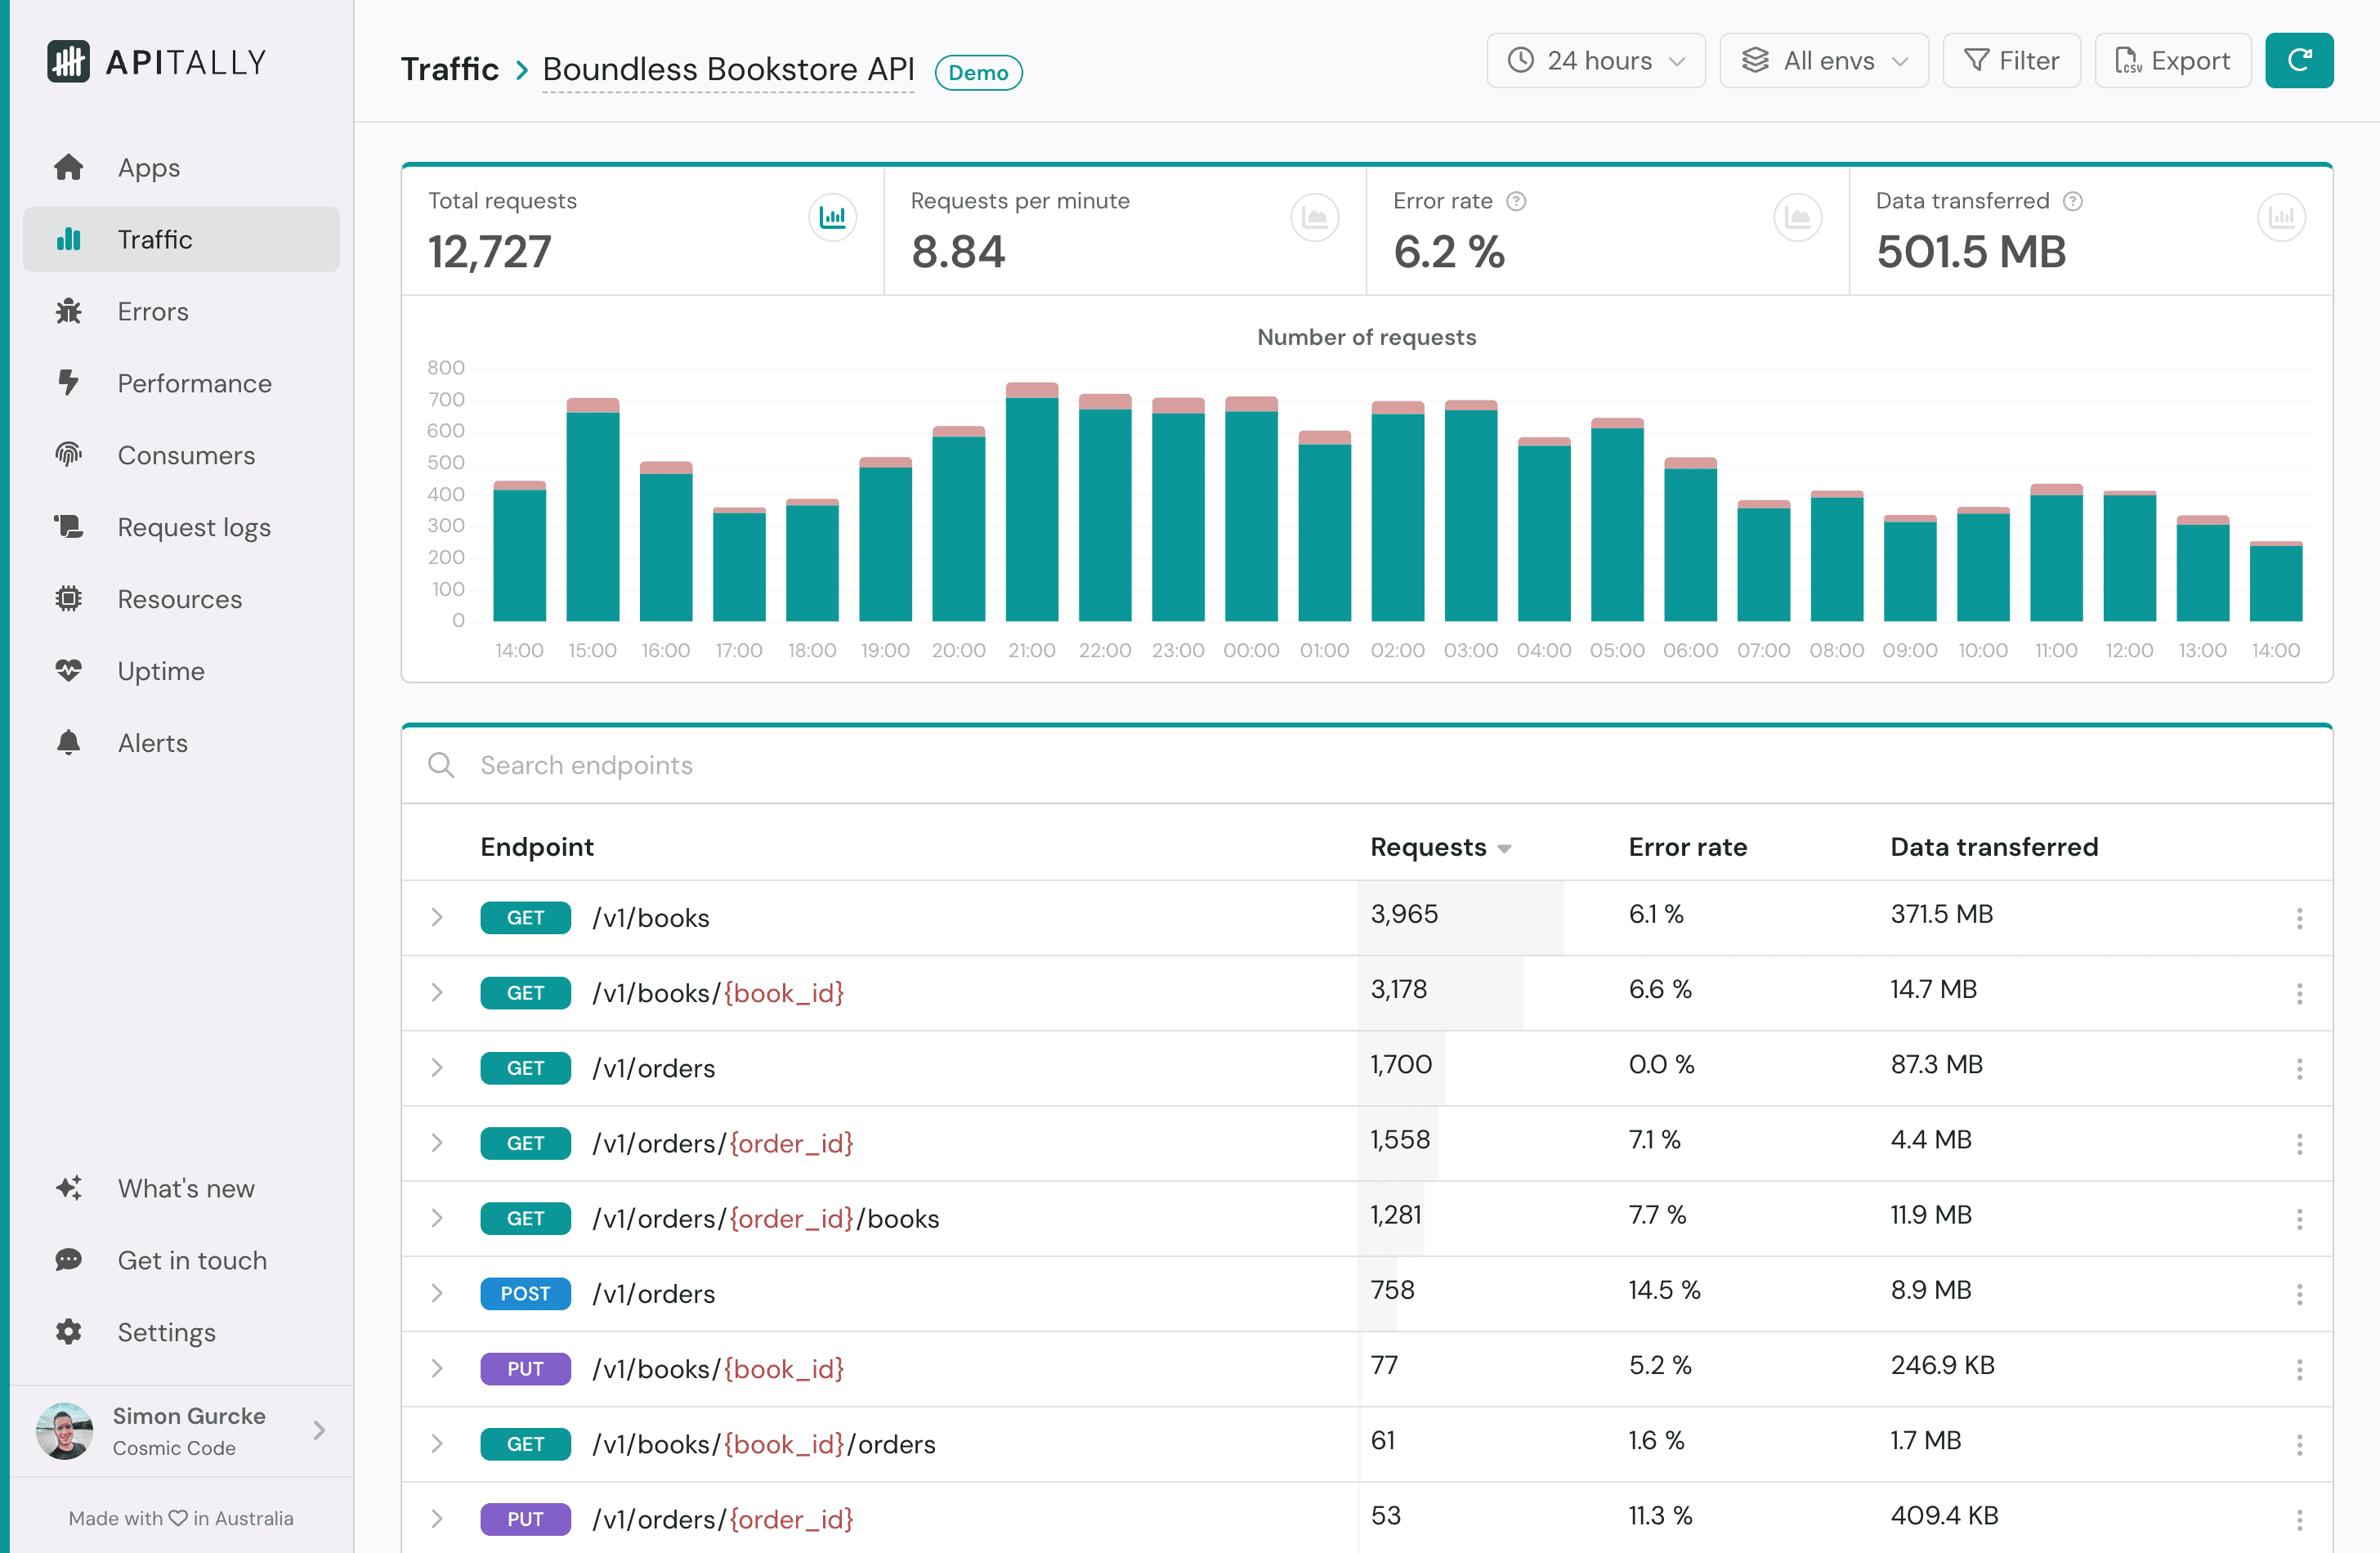
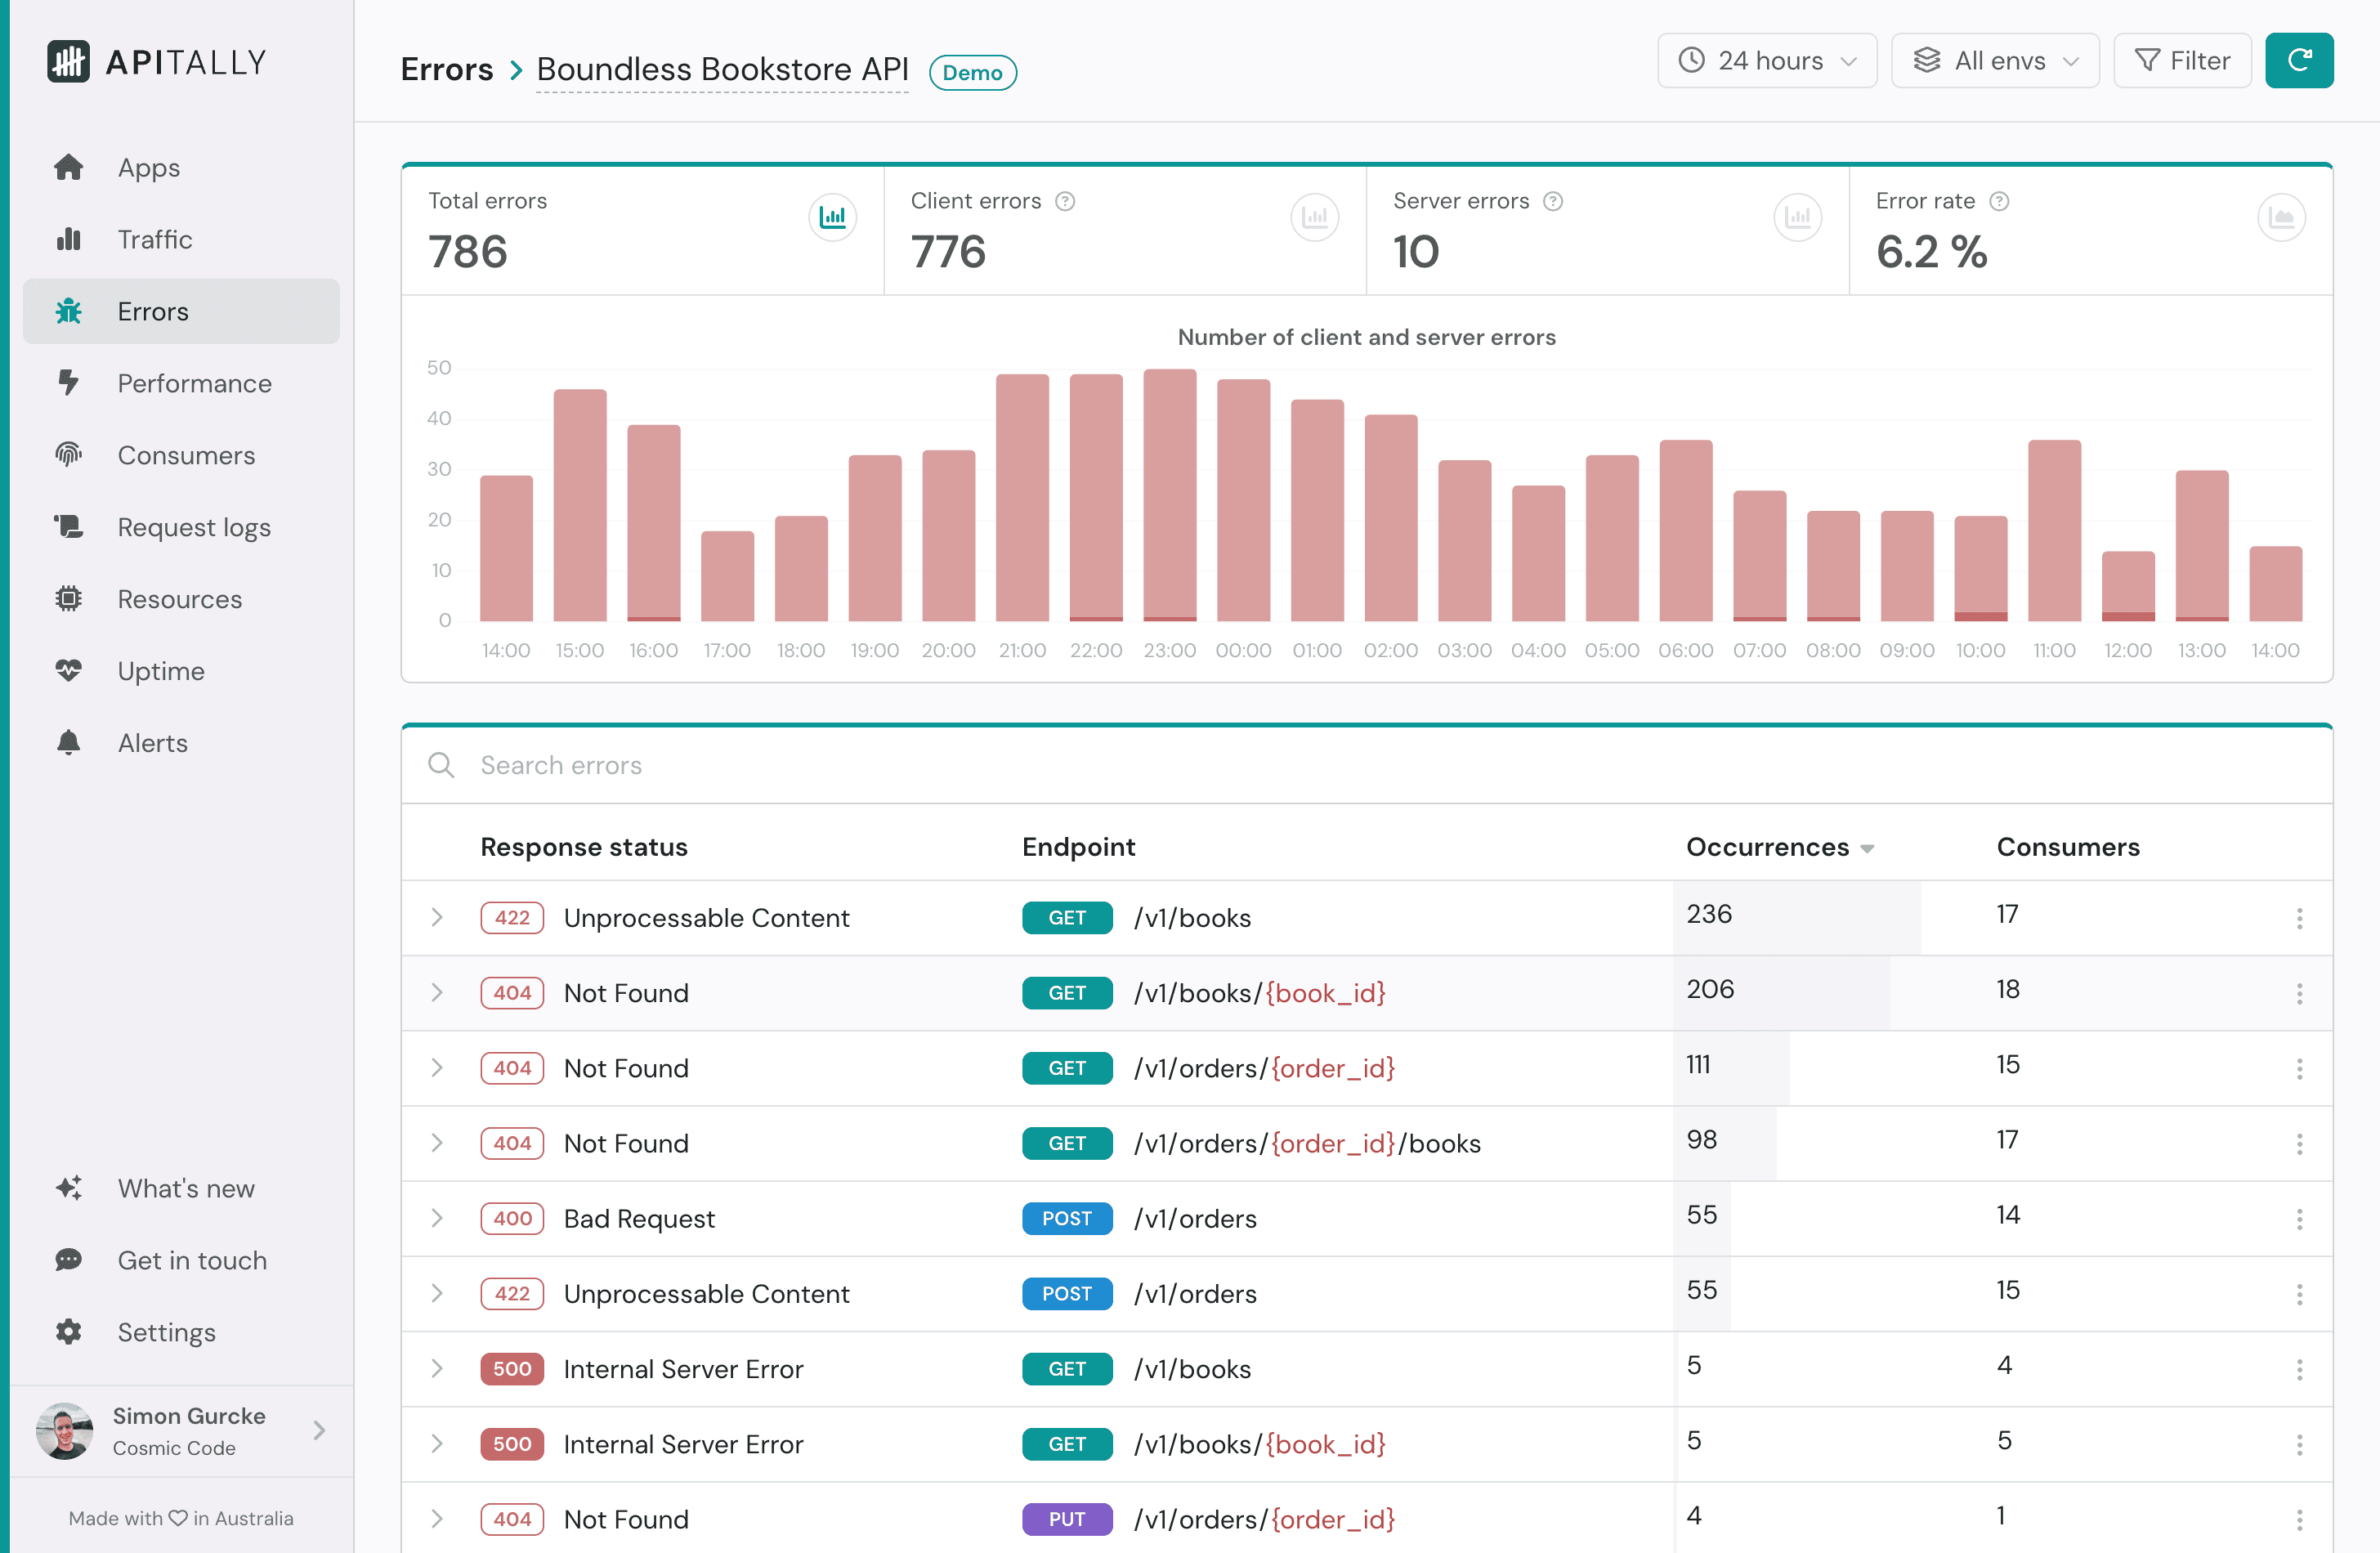
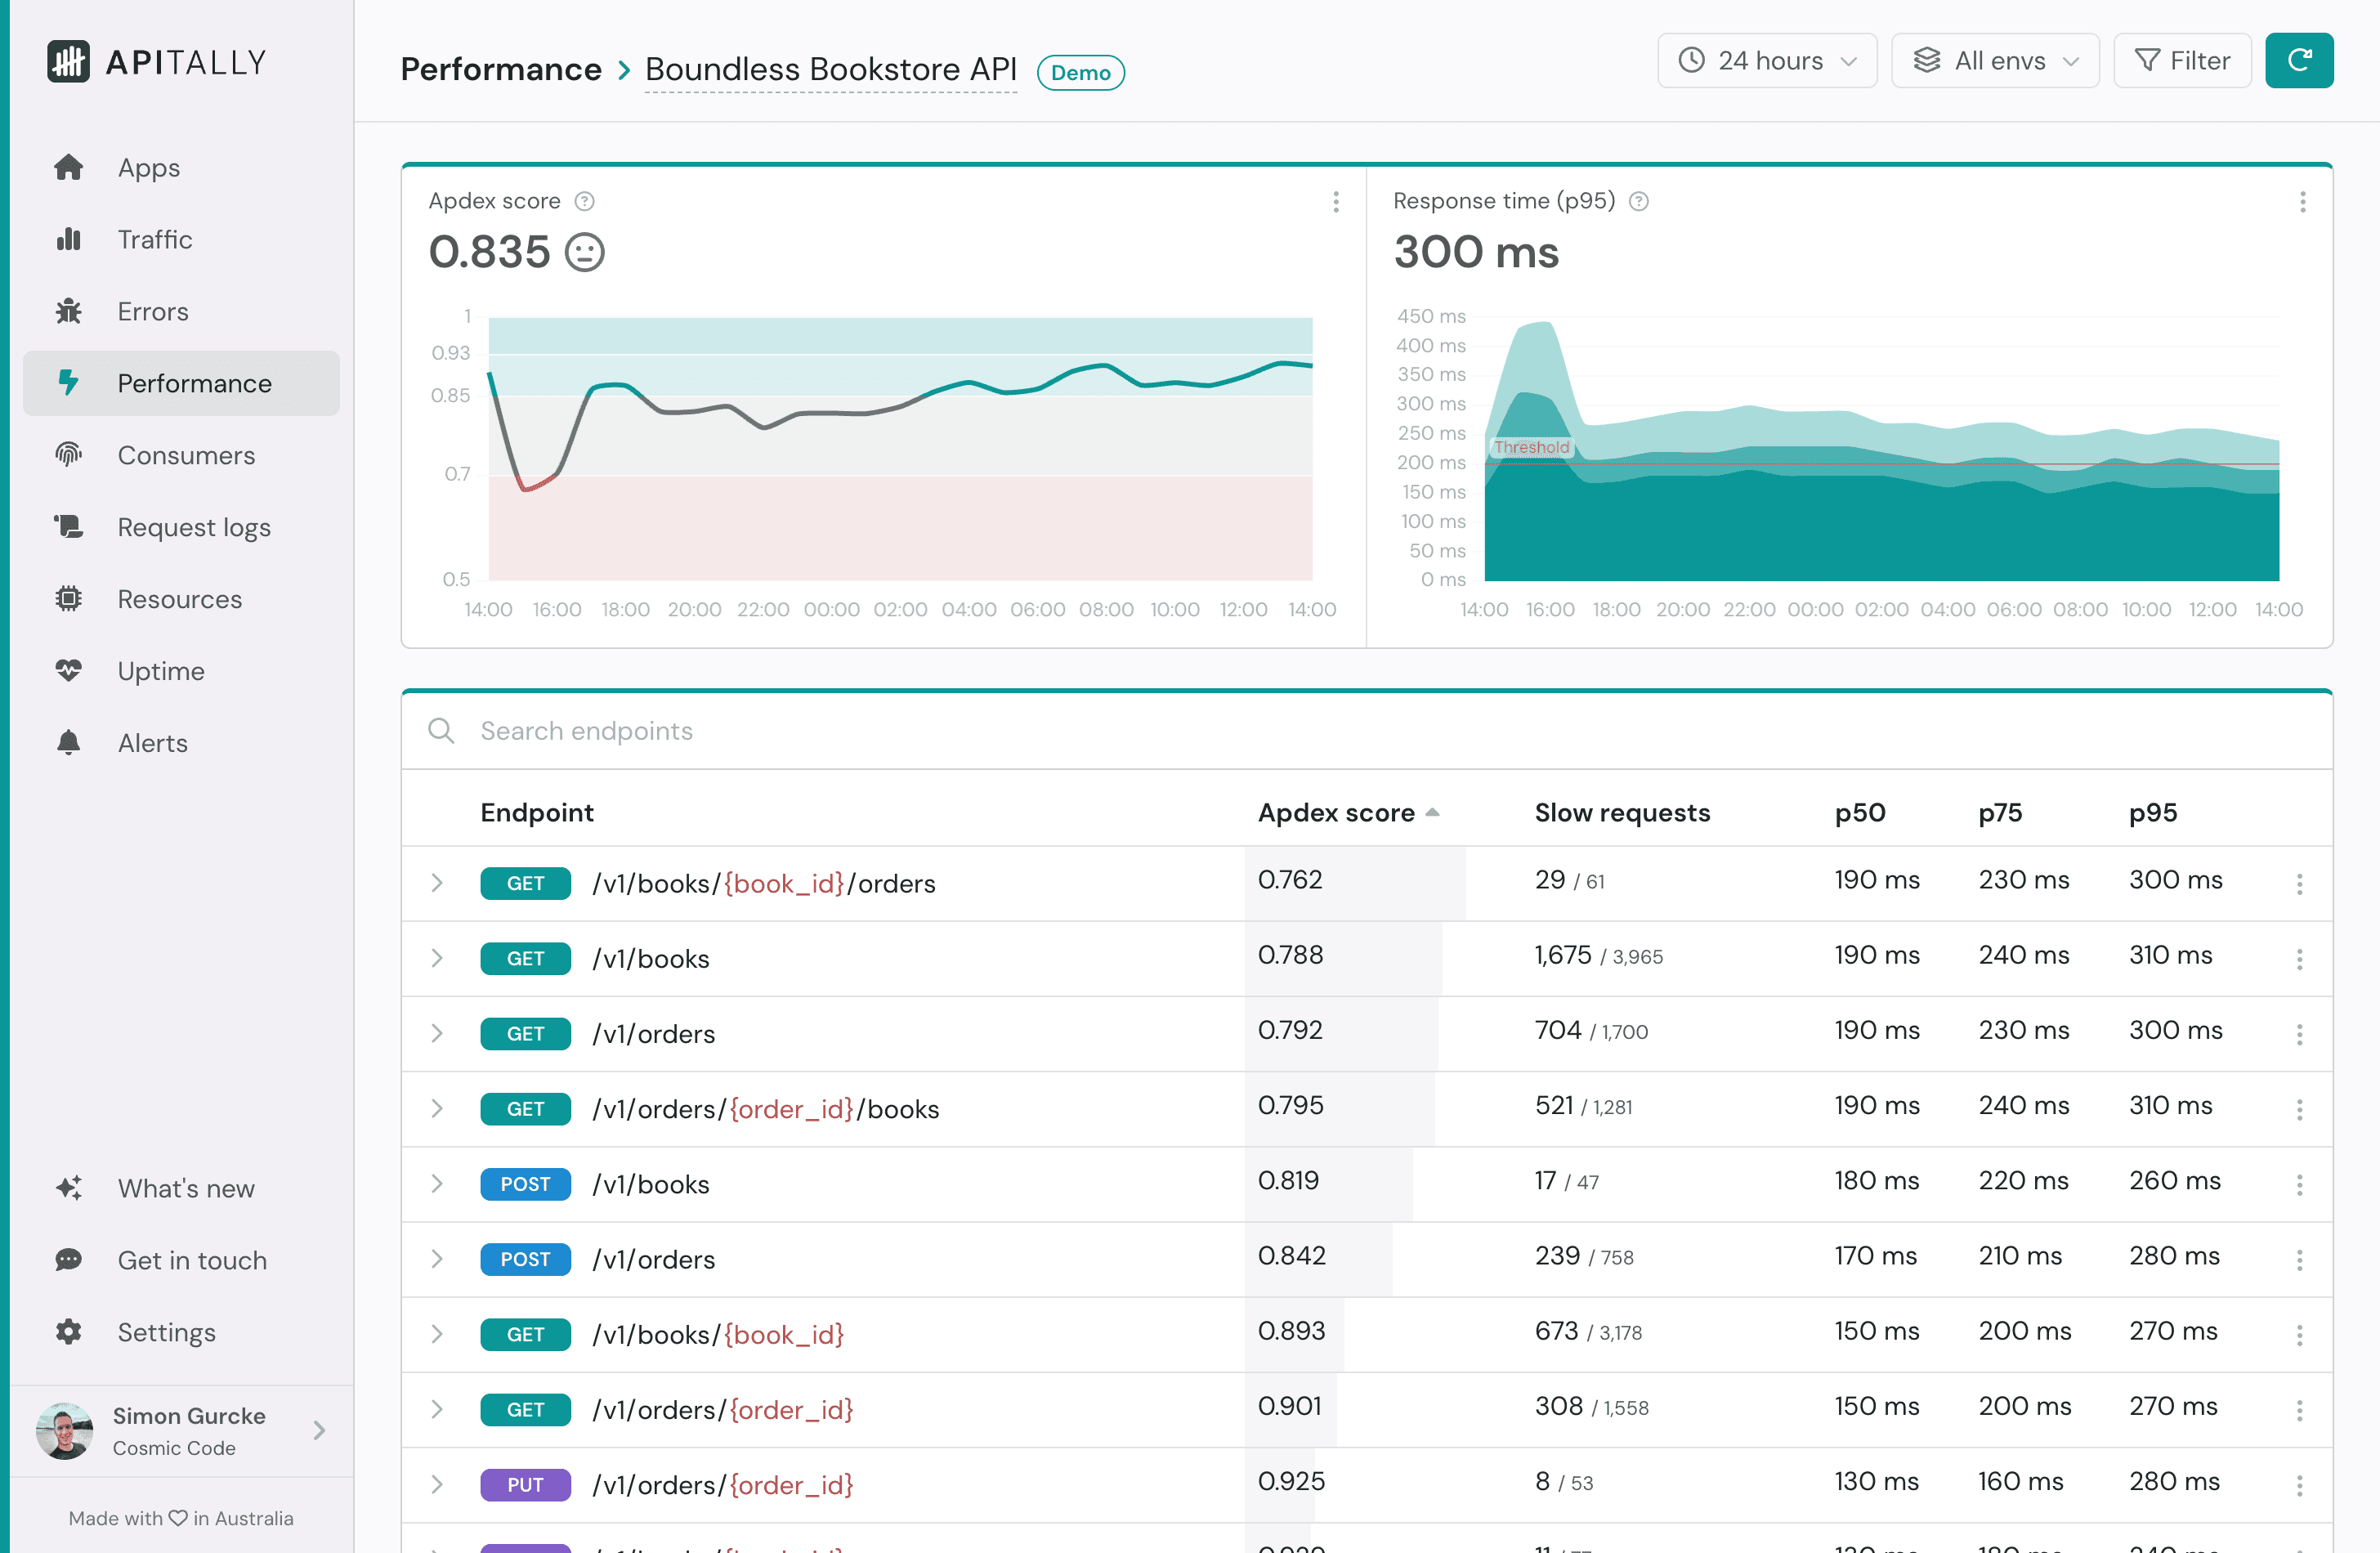
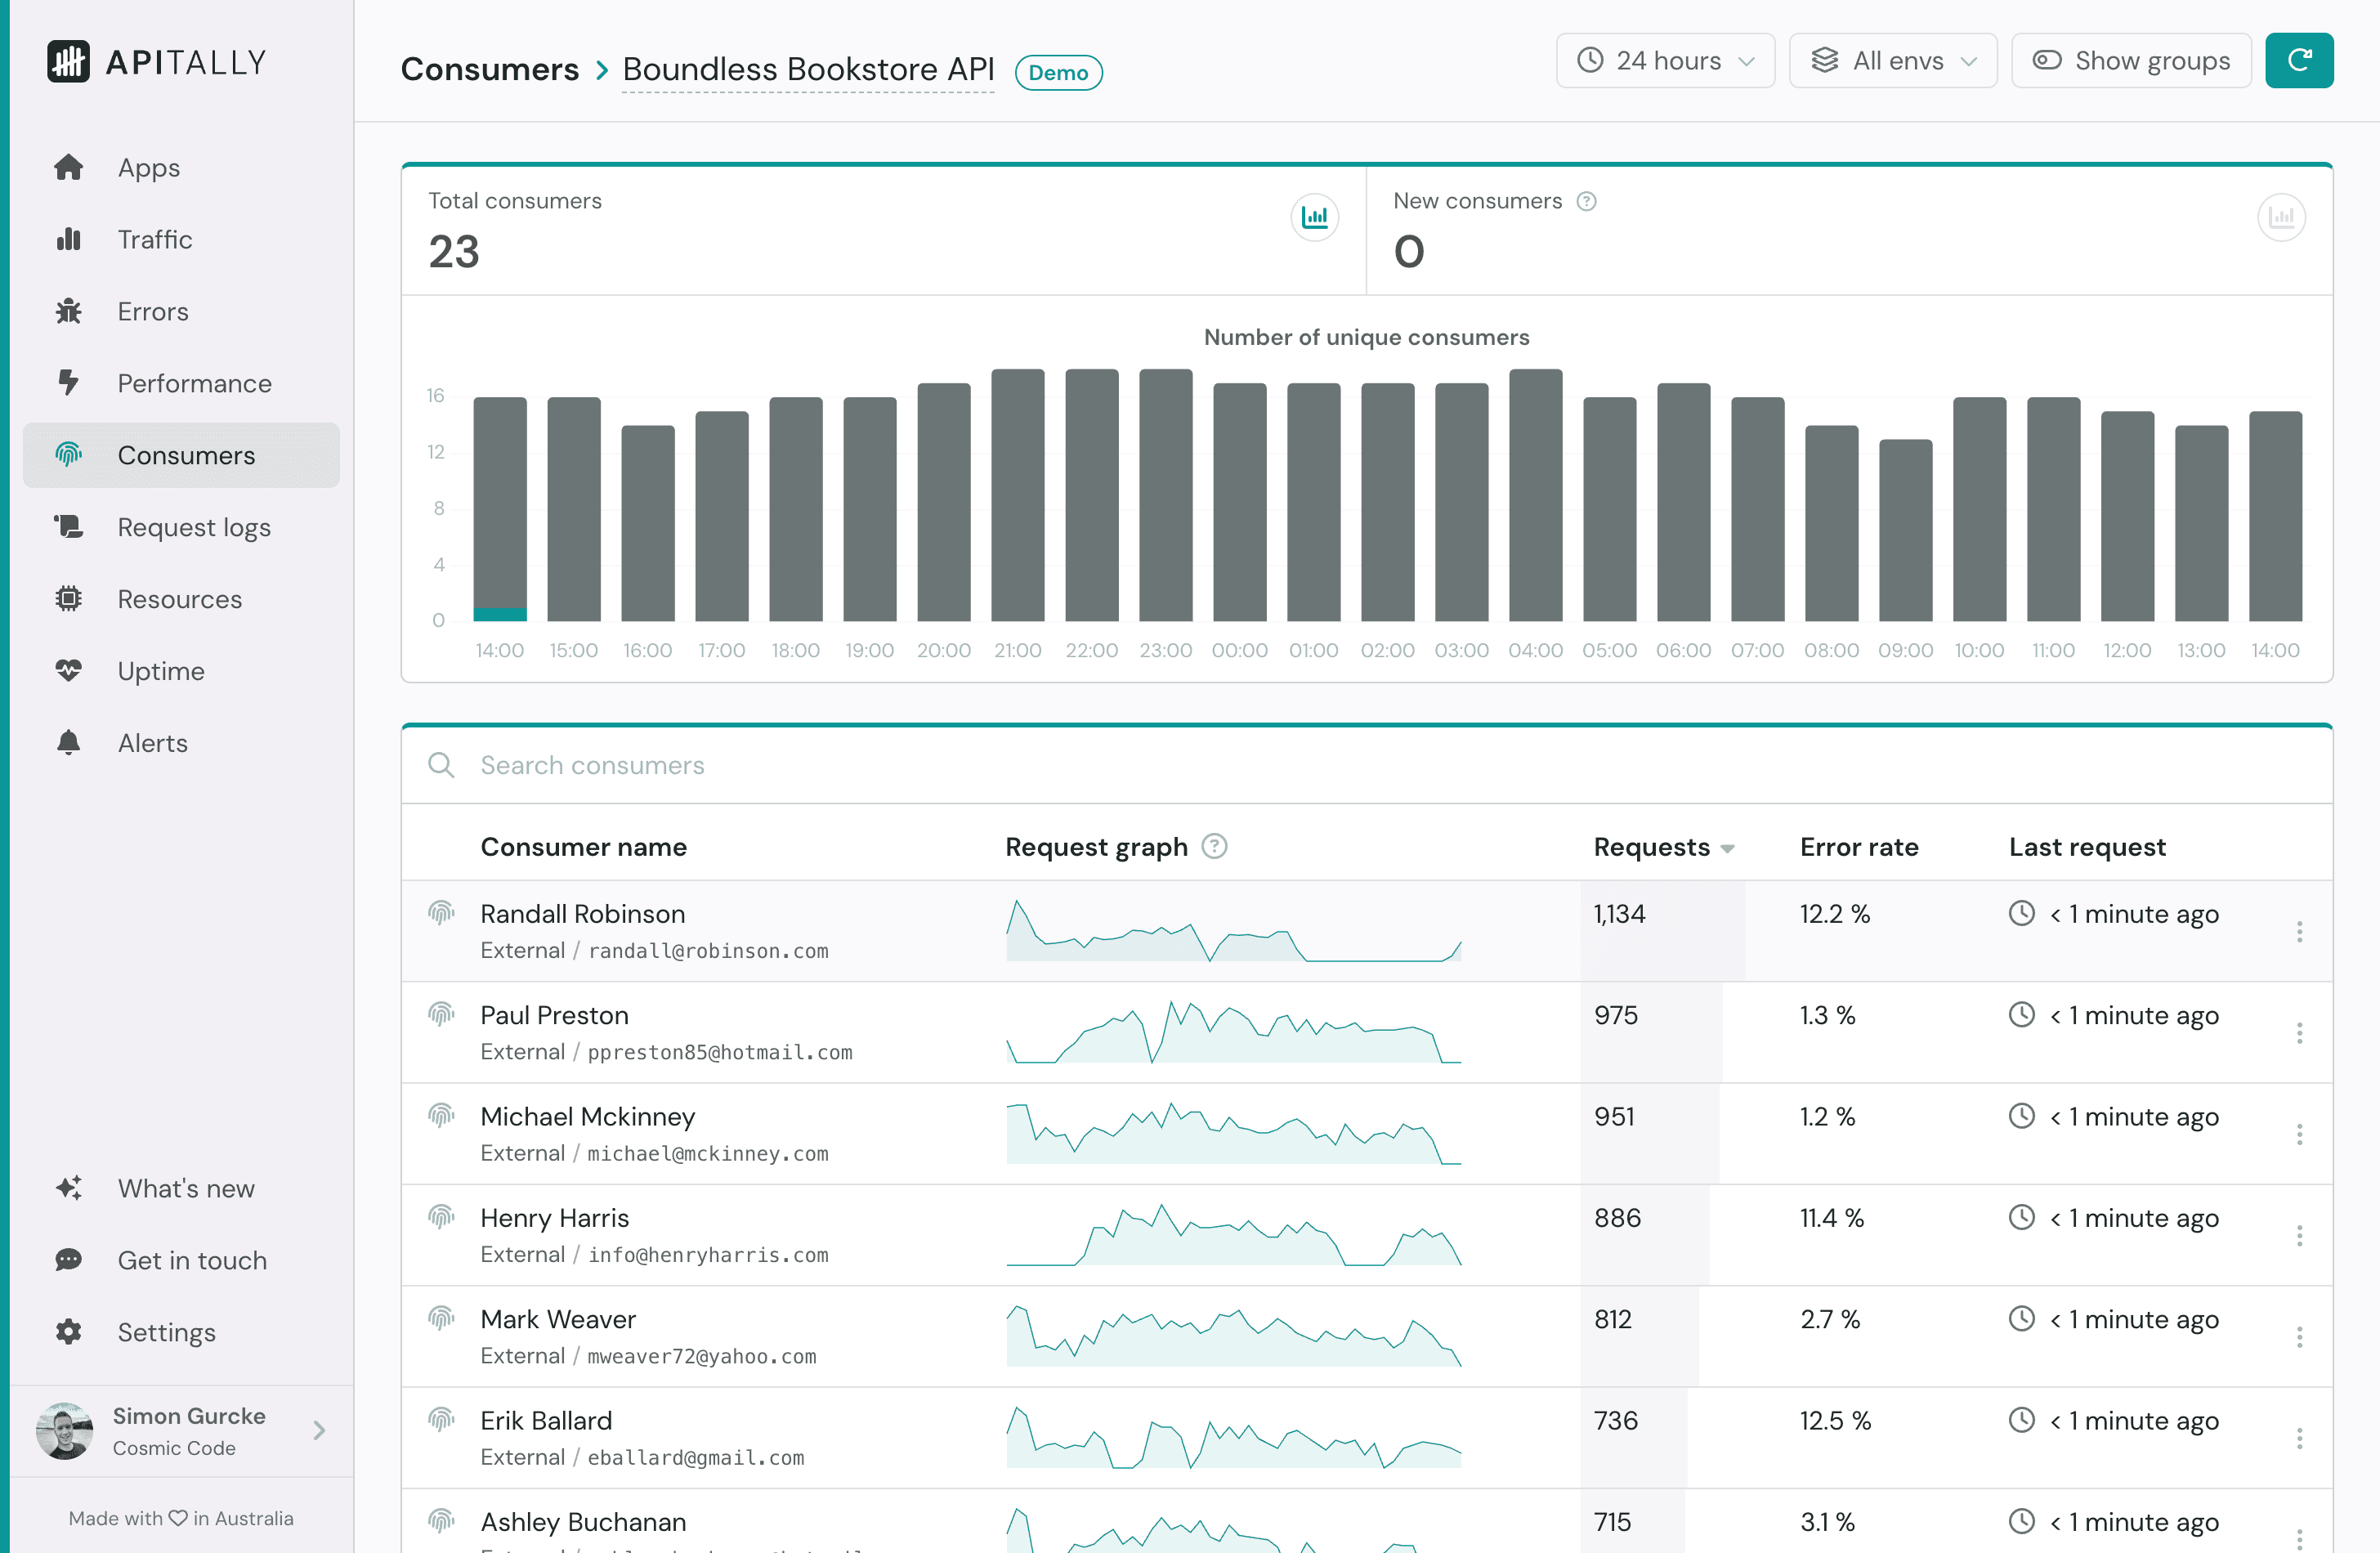
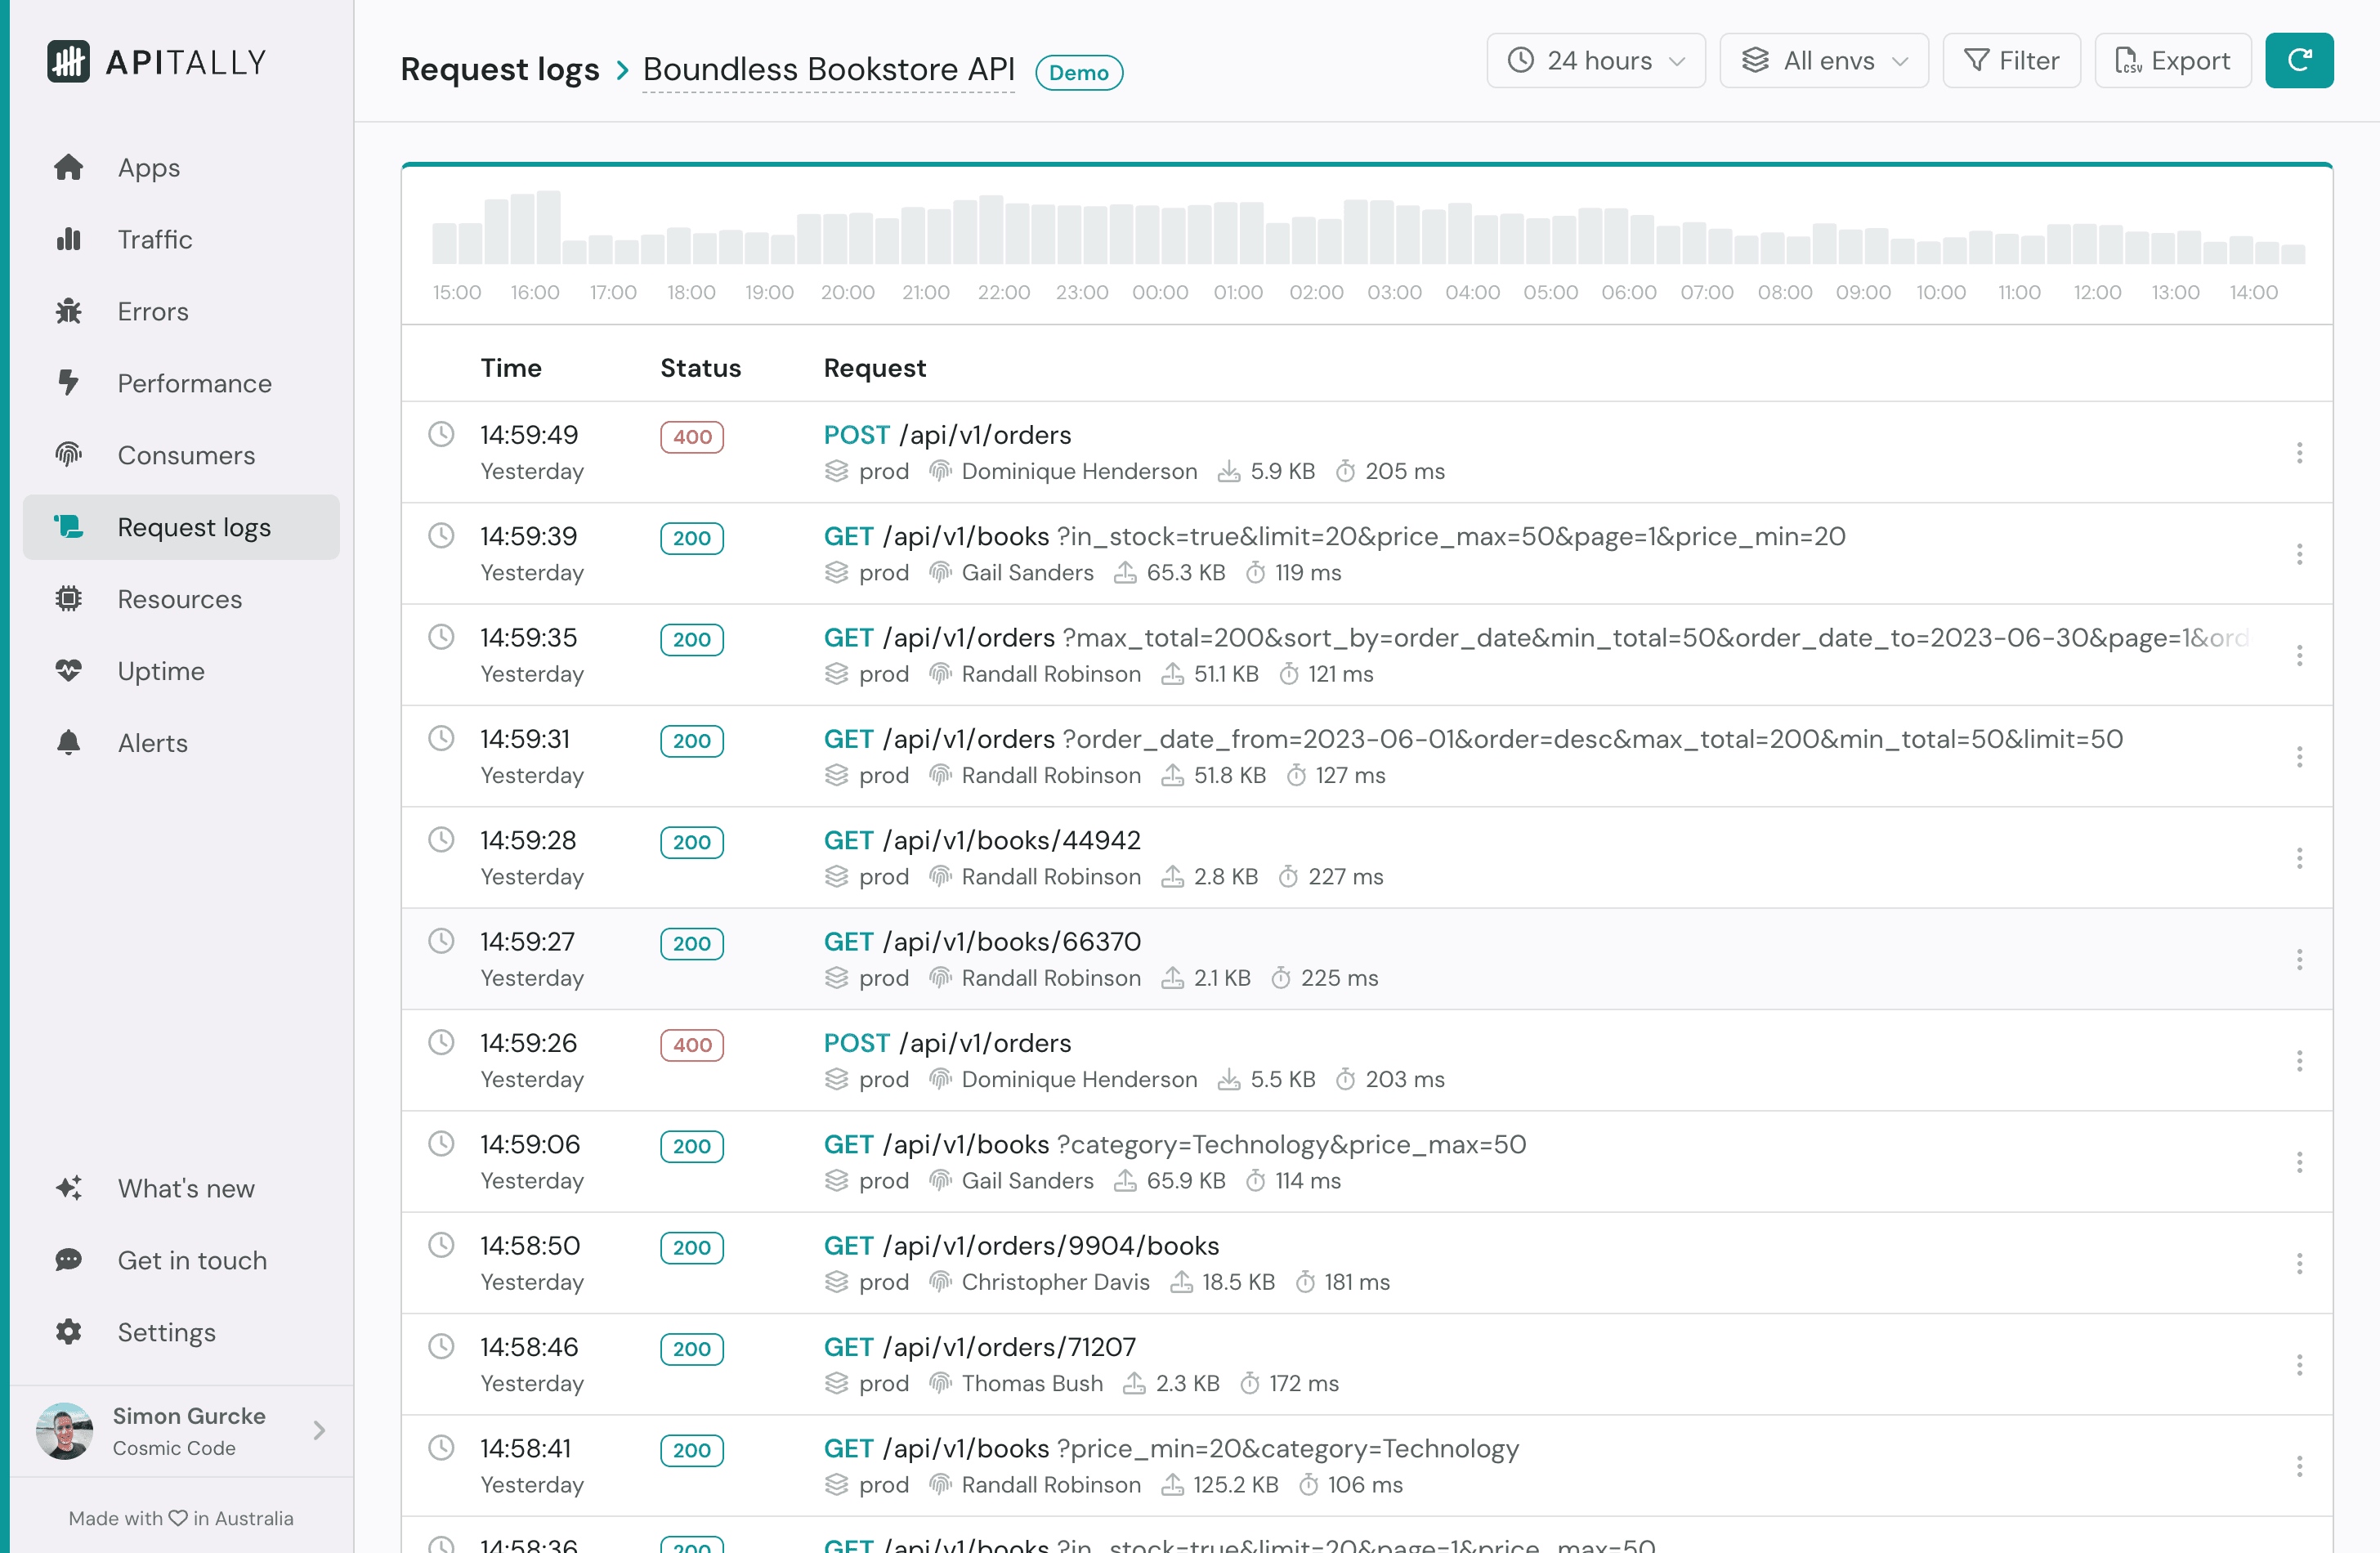
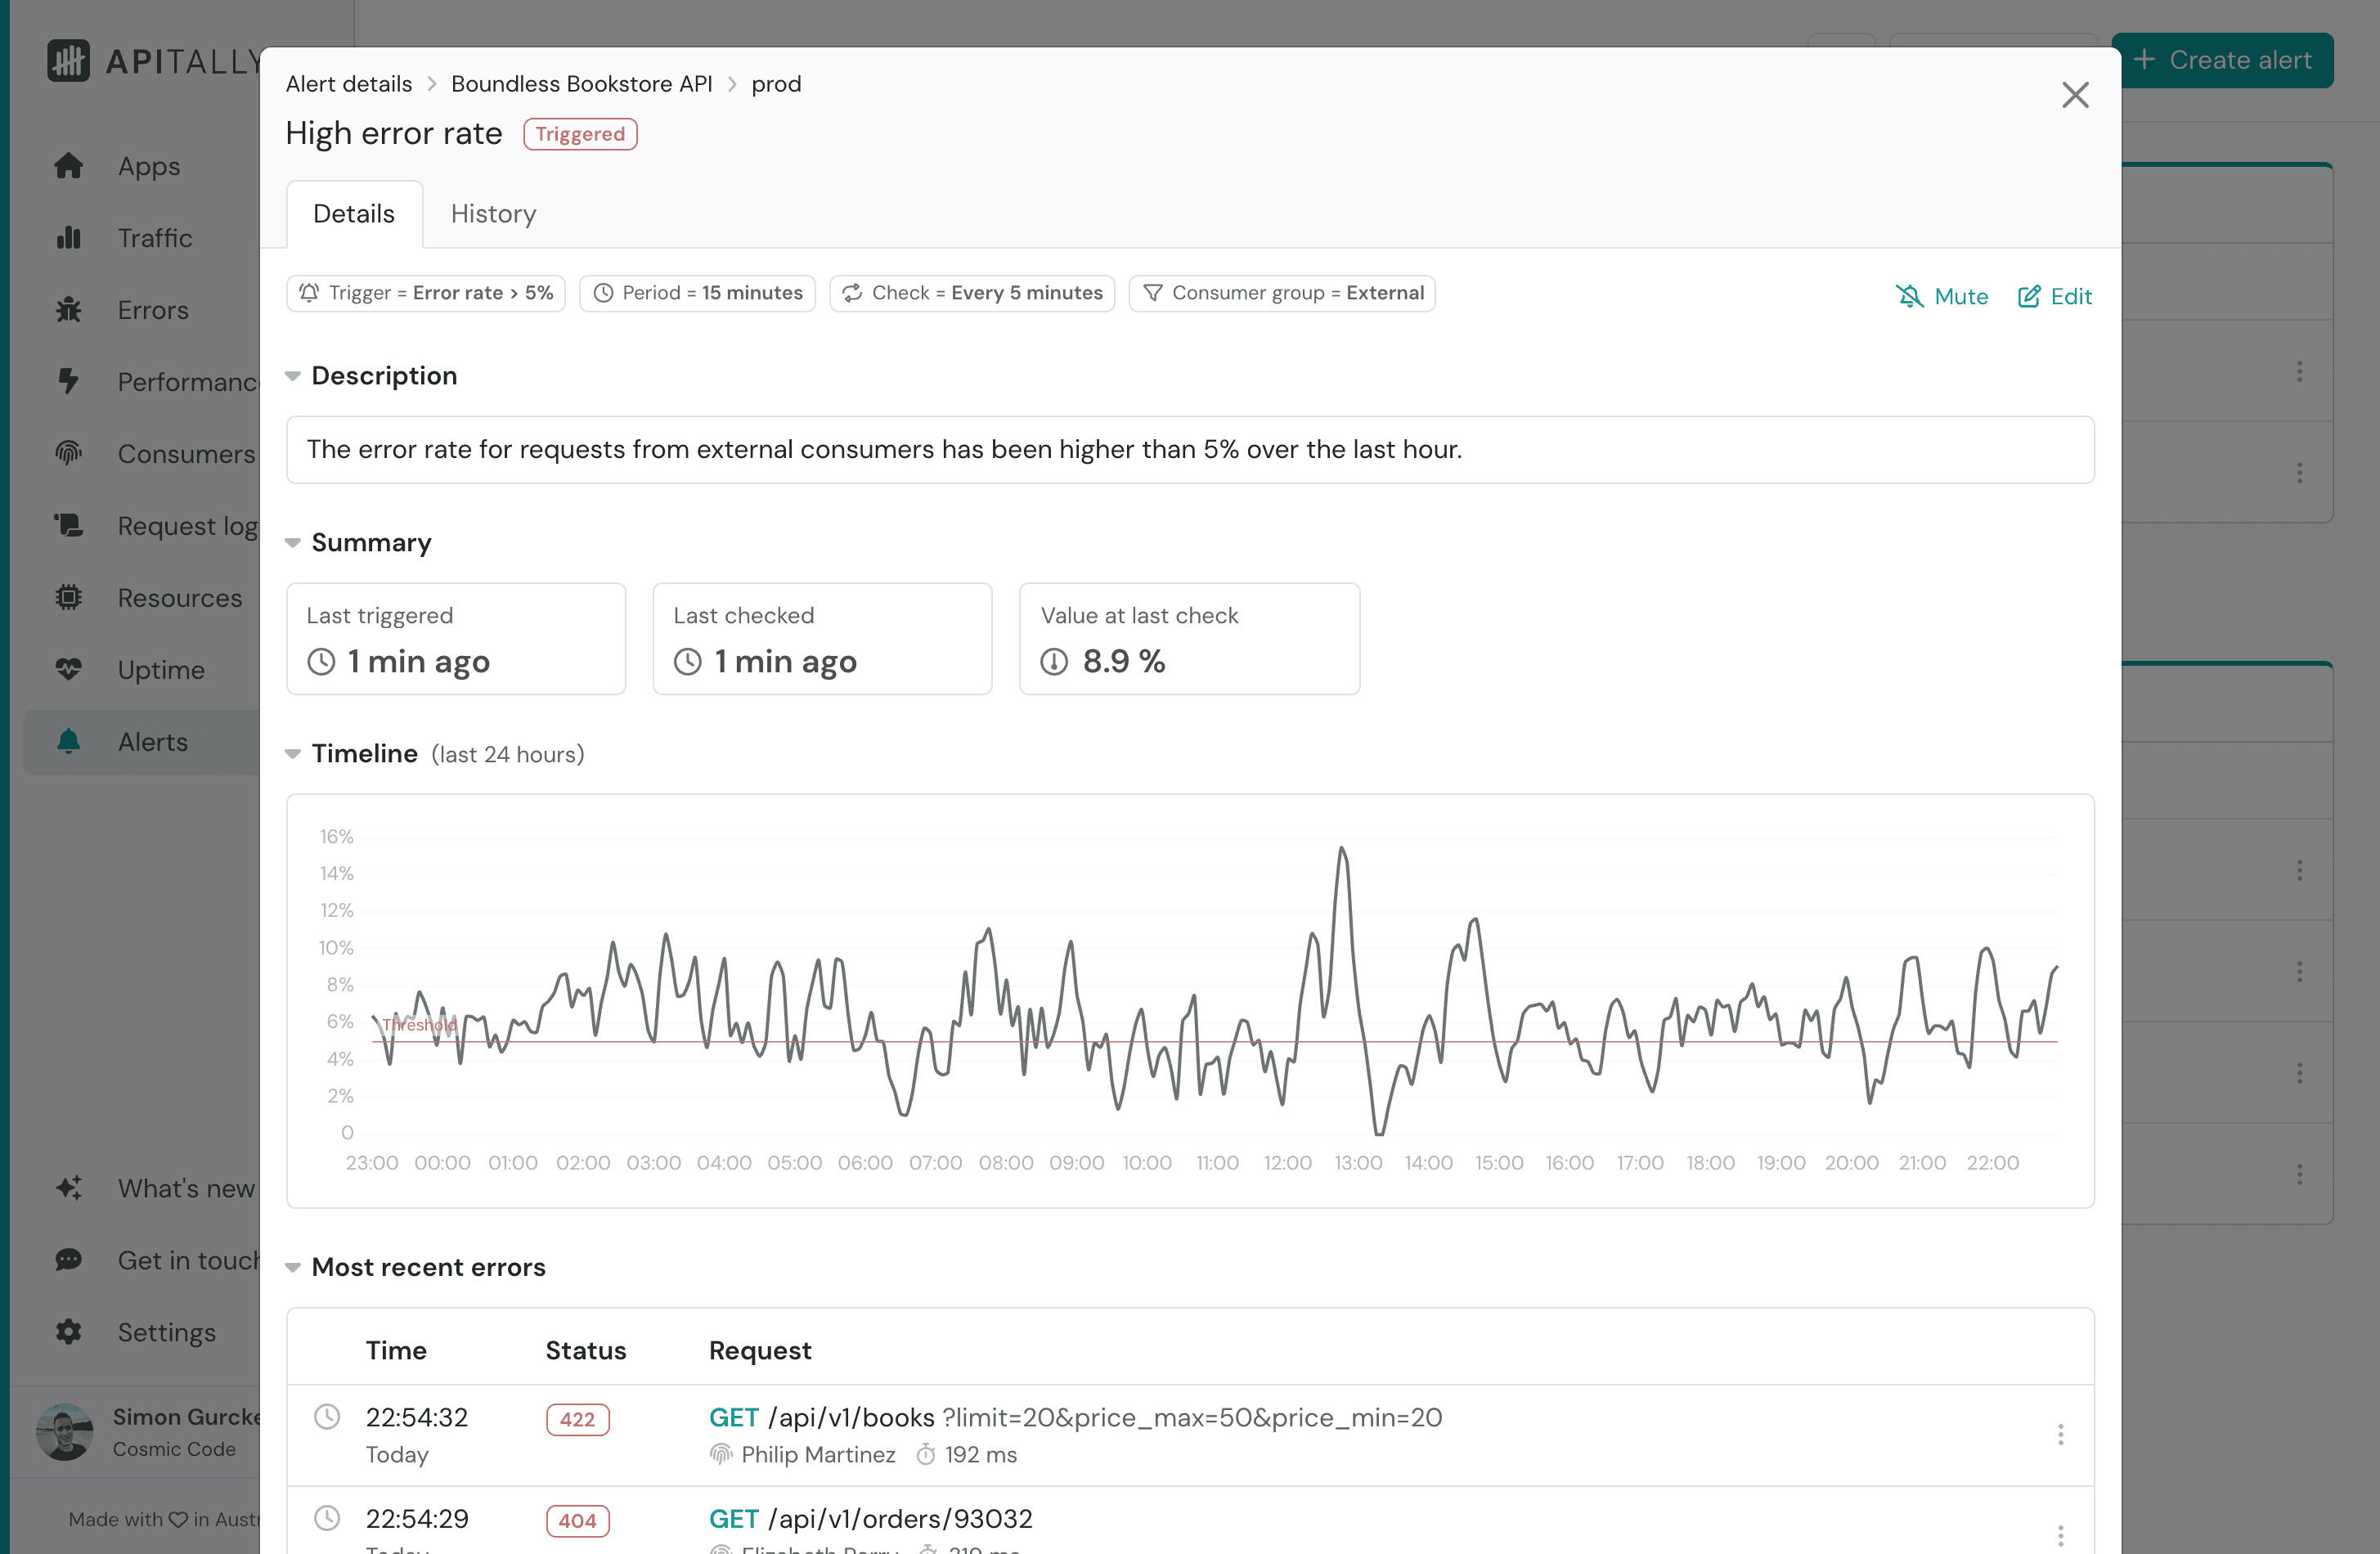
API metrics & analytics: Get actionable API insights with intuitive dashboards
Real-time visibility into your APIs helps you catch issues early and make data-driven decisions, leading to more robust APIs your users can depend on.
- Traffic: Track request volume over time, per endpoint and per consumer
- Errors: Monitor client and server errors, understand impact and root cause
- Performance: Analyze response times of your endpoints and identify bottlenecks
- Consumers: Measure adoption and see how individual consumers use your API
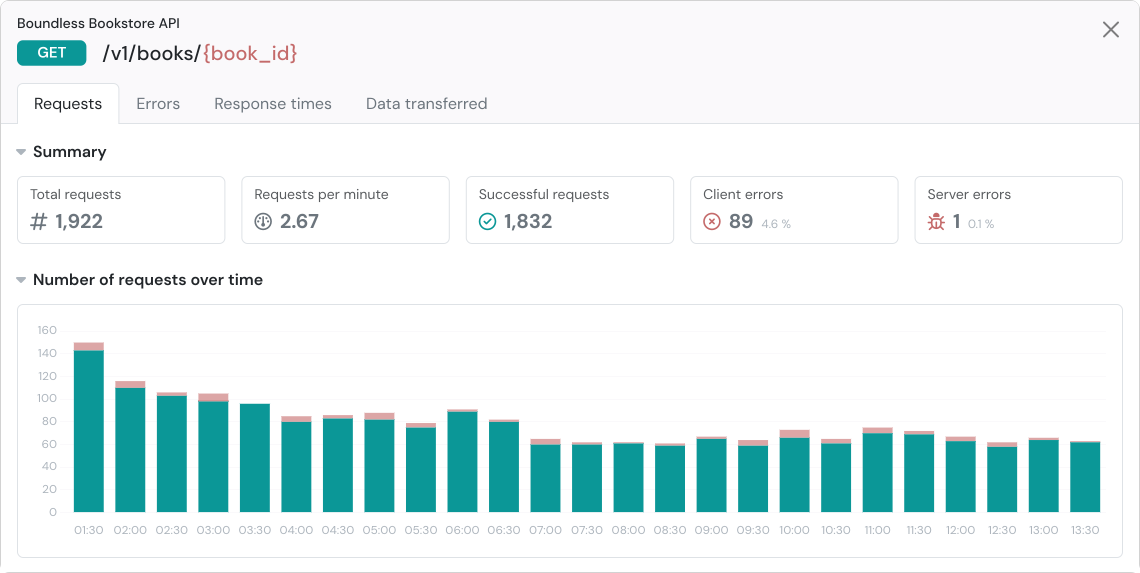
API request logs & traces: Log, find and inspect any API request and response
Drill down from high-level insights to individual API requests, or use powerful search and filters to find specific requests. Apitally brings all relevant context for a request into a single view.
- Headers and payloads: Inspect all details of the API request and response
- Application logs: View correlated logs emitted during request handling
- Traces: Pinpoint slow database queries, external API calls, and other bottlenecks
Request logging is optional and works independently of our analytics and monitoring features.
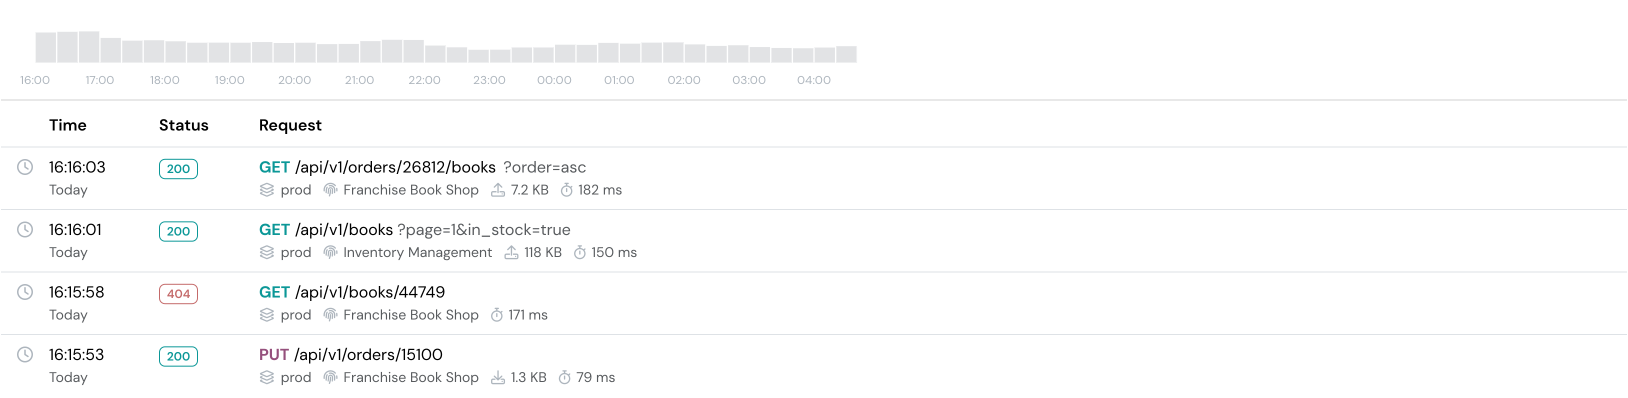
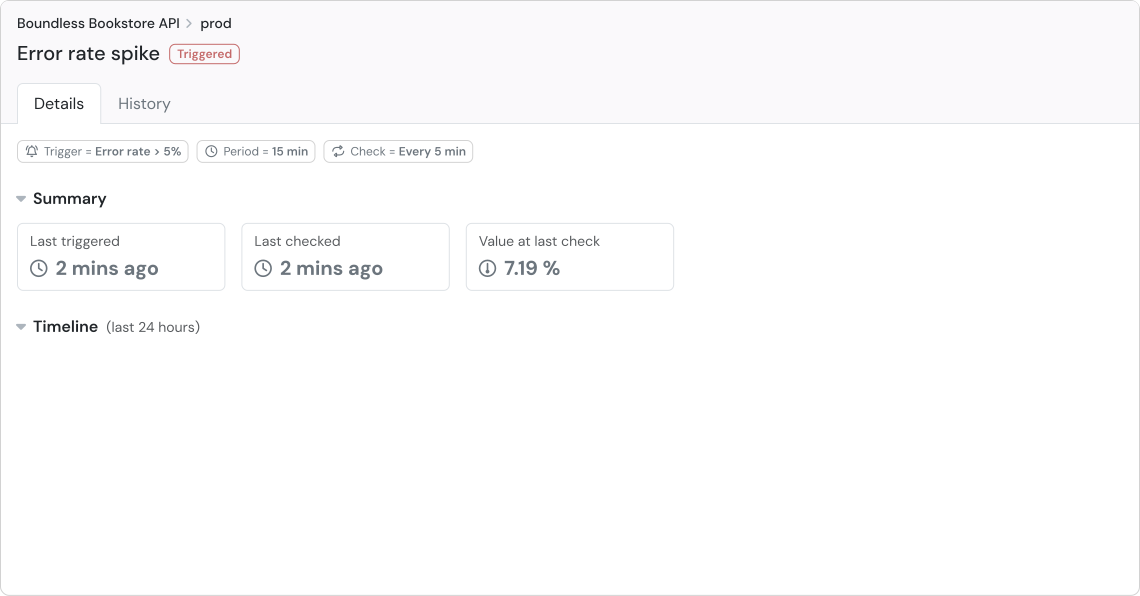
API monitoring & alerts: Know about API problems the moment they happen
Get notified immediately if something isn't right, so you can address it before it impacts consumers. Whether it's downtime, traffic spikes, errors or performance issues, Apitally has you covered.
- Custom alerts: Configure thresholds for 14 different traffic, error and performance metrics and get notified when they are breached.
- Uptime checks: Get notified when your application stops sending regular heartbeats to our servers.
- Health checks: Monitor your API's availability through synthetic HTTP GET requests sent to a specified endpoint at regular intervals.
Other benefits: Made for developers and product owners
Testimonials: What our users are saying


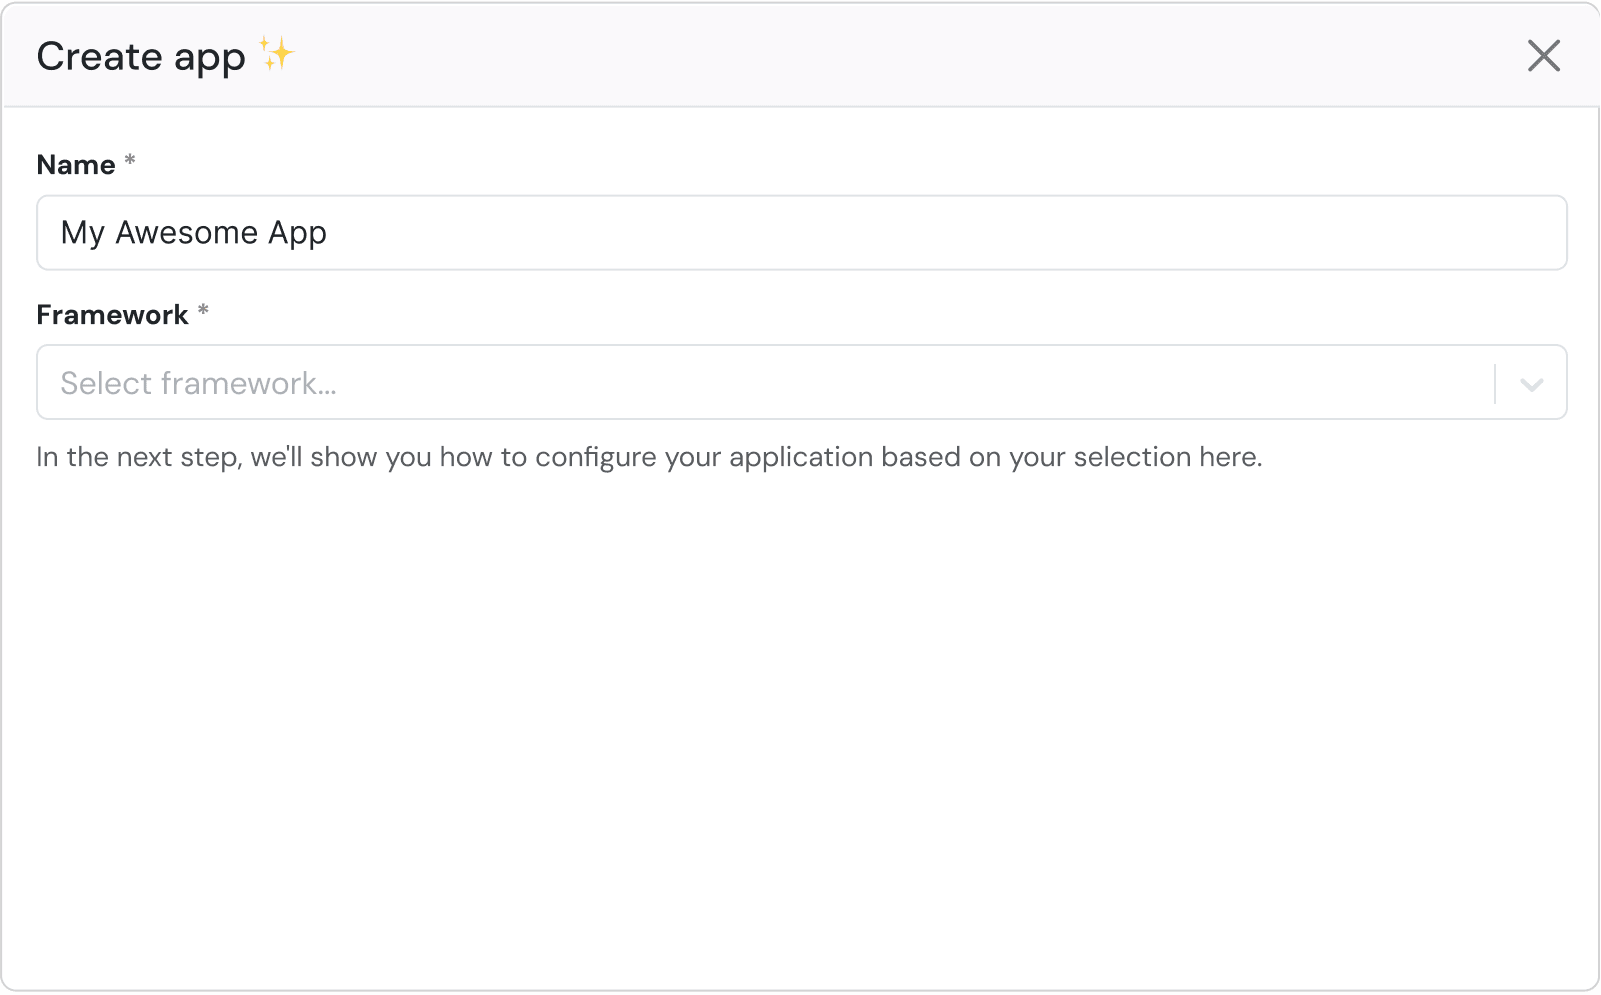
Easy setup: Get started in 3 simple steps
import (
    apitally "github.com/apitally/apitally-go/fiber-v2"
    "github.com/gofiber/fiber/v2"
)

func main() {
    app := fiber.New()

    config := apitally.NewConfig()
    config.WriteToken = "your-write-token"
    config.Env = "dev" // or "prod" etc.

    apitally.Init(app, config)
}
Pricing: Choose the right plan for you
Try Apitally free for 14 days, then decide which plan best suits your needs. No credit card required at sign up.
- 1 app
- 1 dashboard user
- 100 API consumers
- Unlimited API requests for metrics
- 1M request logs / month
- Application logs & traces
- Slack & Teams integration
- 3 apps
- 3 dashboard users
- 1,000 API consumers
- Unlimited API requests for metrics
- 5M request logs / monthOverage: $2.00 per 1M
- 20M logs & spans / monthOverage: $1.00 per 1M
- Slack & Teams integration
- 10 apps
- Unlimited dashboard users
- Unlimited API consumers
- Unlimited API requests for metrics
- 25M request logs / monthOverage: $2.00 per 1M
- 100M logs & spans / monthOverage: $1.00 per 1M
- Slack & Teams integration
Frequently asked questions: Learn more before you dive in
Can't find the answer you're looking for? Reach out via email or on Slack and we'll get back to you as soon as we can.
Apitally currently supports the following web frameworks:
- AdonisJS (Node.js)
- ASP.NET Core (C#)
- BlackSheep (Python)
- Chi (Go)
- Django Ninja (Python)
- Django REST Framework (Python)
- Echo (Go)
- Elysia (Bun)
- Express (Node.js)
- FastAPI (Python)
- Fastify (Node.js)
- Fiber (Go)
- Flask (Python)
- Gin (Go)
- H3 (Node.js / Deno / Bun)
- hapi (Node.js)
- Hono (Node.js / Bun)
- Koa (Node.js)
- Litestar (Python)
- NestJS (Node.js)
- Starlette (Python)
Please let us know if you're interested in using Apitally with a framework that is currently not supported.
Yes. The Apitally SDKs for Python, JavaScript, Go and .NET are built on OpenTelemetry and send metrics, logs and traces to Apitally using OTLP, without requiring a separate collector or agent. If your application already uses OpenTelemetry, the SDK works alongside your existing setup, and you can use standard OpenTelemetry instrumentation libraries to add spans to your traces.
Apitally's dashboards rely on data that only the Apitally SDKs send, such as the endpoints discovered in your application and request metrics aggregated by endpoint, status code and consumer. Sending data to Apitally from other OpenTelemetry SDKs or an OpenTelemetry Collector is therefore not supported.
The SDKs are designed to keep overhead low. In our benchmarks, they added less than 1 ms to response times on average, even with request and response bodies captured.
The SDKs aggregate request metrics in memory and send collected data to Apitally in the background, separately from request handling, normally about once a minute.
For API metrics, the Apitally SDKs record the method, path, status code, response time and payload sizes of each request, and combine them into counts and histograms within your application before sending them to Apitally. Aggregated metrics are retained for 13 months.
Request logs capture the details of individual requests, such as the URL, client IP address, user agent, response headers and response time, along with related application logs and traces. Request headers and request and response bodies are only captured if you enable them. Request logs, application logs and traces are retained for 15 days, with longer retention available on request.
Read more about data collection and retention in our docs.
Apitally offers a CLI and agent skill that give AI agents like Claude Code, Cursor, and Codex full access to your API metrics and request logs. We chose this approach over MCP because it's more token-efficient and reliable, while giving agents richer investigation capabilities.
Read more about it in our blog post.