A practical guide to logging in Hono
From Hono's built-in logger to production-ready structured logging with Pino.

When something goes wrong in production, logs are usually the first thing you look at. Well-structured logs let you trace a request through your Hono API and pinpoint where things went wrong.
API logging has two sides: request logs capture details about each API request and response, while application logs contain detailed messages emitted by your application during request handling. Ideally, both are correlated so you can see what happened inside your route handlers for any given request.
This article covers how to set up logging in a Hono application, from the built-in logger middleware to production-ready structured logging with Pino. I’ll also introduce Apitally as a simple solution for capturing detailed request logs with correlated application logs and making them searchable on a dashboard.
Hono’s built-in logger middleware
Hono ships with a simple logger middleware that logs the HTTP method, path, status code, and response time for each request.
import { Hono } from "hono";
import { logger } from "hono/logger";

const app = new Hono();

app.use(logger());

app.get("/hello", (c) => c.text("Hello Hono!"));
When a request comes in, you’ll see two lines in the console:
<-- GET /hello
--> GET /hello 200 2ms
For quick debugging during development, the built-in logger often does the job. However, it has some limitations that make it impractical for use in production:
- It outputs plain text, not structured JSON, so log aggregation tools can’t parse it
- There’s no way to log headers, query parameters, or request/response bodies
- It doesn’t provide a logger instance you can use in route handlers for application logging
- There are no log levels (info, warn, error)
Custom logging middleware
Building your own logger middleware in Hono is straightforward and allows you to fully control the log output. You can record the start time before calling await next(), then log the result after the response is ready.
Here’s a middleware that outputs structured JSON with the response time:
import { Hono } from "hono";

const app = new Hono();

app.use(async (c, next) => {
  const start = performance.now();
  await next();
  const duration = performance.now() - start;

  console.log(JSON.stringify({
    timestamp: new Date().toISOString(),
    method: c.req.method,
    path: c.req.path,
    status: c.res.status,
    durationMs: Math.round(duration),
  }));
});

app.get("/hello", (c) => c.text("Hello!"));
This produces output like:
{"timestamp":"2026-03-08T10:30:00.123Z","method":"GET","path":"/hello","status":200,"durationMs":2}
Structured JSON logs are easier to work with in production because log aggregation tools, like CloudWatch, can parse, index, and query them directly.
Request IDs for log correlation
When your API handles many requests concurrently, their log entries are interleaved in the output. Without a shared identifier, you can’t tell which entries belong to the same request. A unique request ID attached to every log entry solves this.
Hono has a built-in Request ID middleware that generates a UUID for each incoming request and makes it available via the context:
import { Hono } from "hono";
import { requestId } from "hono/request-id";

const app = new Hono();

app.use(requestId());

app.use(async (c, next) => {
  const start = performance.now();
  await next();
  const duration = performance.now() - start;

  console.log(JSON.stringify({
    timestamp: new Date().toISOString(),
    requestId: c.var.requestId,
    method: c.req.method,
    path: c.req.path,
    status: c.res.status,
    durationMs: Math.round(duration),
  }));
});

app.get("/hello", (c) => c.text("Hello!"));
Each log entry now includes the request ID:
{"timestamp":"2026-03-08T10:30:00.123Z","requestId":"8a3c2b1d-4e5f-6a7b-8c9d-0e1f2a3b4c5d","method":"GET","path":"/hello","status":200,"durationMs":2}
The requestId middleware should be registered before any middleware that needs access to the ID. It also adds the X-Request-Id header to the response automatically.
If an incoming request already includes an X-Request-Id header, the middleware reuses that value instead of generating a new one. This lets you trace requests across services.
Structured logging with Pino
If you’re running Hono on Node.js in production, I recommend using a logging library like Pino instead of console.log. Pino gives you log levels, configurable transports, and better performance. The pino-http package adds automatic request completion logging and provides a child logger with the request ID bound, so every log entry can be traced back to the request that produced it.
npm install pino pino-http
The following middleware wraps pino-http for Hono, which is the recommended pattern from the official Pino documentation.
import { Hono } from "hono";
import { requestId } from "hono/request-id";
import { pinoHttp } from "pino-http";

const app = new Hono();

const httpLogger = pinoHttp({
  // Only bind reqId to the child logger, not the full request object
  quietReqLogger: true,
  // Use appropriate log levels based on response status
  customLogLevel: (req, res, err) => {
    if (res.statusCode >= 500 || err) return "error";
    if (res.statusCode >= 400) return "warn";
    return "info";
  },
});

app.use(requestId());
app.use(async (c, next) => {
  // Pass Hono's request ID to pino-http
  c.env.incoming.id = c.var.requestId;
  // Wrap pino-http's Express-style middleware for Hono
  await new Promise<void>((resolve) => {
    httpLogger(c.env.incoming, c.env.outgoing, () => resolve());
  });
  // Make the child logger available on the Hono context
  c.set("logger", c.env.incoming.log);
  await next();
});

app.get("/users/:id", (c) => {
  const userId = c.req.param("id");
  // Use the child logger
  c.var.logger.info({ userId }, "fetching user");
  return c.json({ id: userId, name: "Alice" });
});
A GET /users/123 request now produces two log entries:
{"level":30,"time":1709901000123,"reqId":"dfe66a12-1bc0-4ba7-8a52-03ad08d3a0c6","userId":"123","msg":"fetching user"}
{"level":30,"time":1709901000125,"reqId":"dfe66a12-1bc0-4ba7-8a52-03ad08d3a0c6","req":{"method":"GET","url":"/users/123"},"res":{"statusCode":200},"responseTime":2,"msg":"request completed"}
The first line is the application log from c.var.logger.info(). The second is the request completion log that pino-http writes automatically after the response. Both share the same reqId from Hono’s Request ID middleware.
This example uses c.env.incoming and c.env.outgoing to access the underlying Node.js request and response objects, which only works when running Hono with @hono/node-server.
Development output
Raw JSON isn’t very easy to scan for the human eye. You can install pino-pretty and use it as a transport to get human-readable and color-coded output during development instead:
npm install --save-dev pino-pretty
const isDev = process.env.NODE_ENV !== "production";

const httpLogger = pinoHttp({
  quietReqLogger: true,
  // Use pino-pretty in development only
  transport: isDev ? { target: "pino-pretty" } : undefined,
});
The same GET /users/123 request now produces the following log output, which is much easier to read:
[1709901000123] INFO (12345): fetching user
    reqId: "dfe66a12-1bc0-4ba7-8a52-03ad08d3a0c6"
    userId: "123"
[1709901000125] INFO (12345): request completed
    reqId: "dfe66a12-1bc0-4ba7-8a52-03ad08d3a0c6"
    req: {
      "method": "GET",
      "url": "/users/123"
    }
    res: {
      "statusCode": 200
    }
    responseTime: 2
In production, with no transport configured, Pino still writes JSON to stdout. Your container runtime or log collector can pick it up from there.
Error logging
Hono’s app.onError hook catches all unhandled exceptions from the middleware chain and route handlers. You can use it for centralized error logging.
With the Pino setup from above, the logger is already available on the context:
app.onError((err, c) => {
  c.var.logger.error({
    err: {
      message: err.message,
      stack: err.stack,
    },
  }, "unhandled error");

  return c.json({ error: "Internal Server Error" }, 500);
});
Now, if a route handler throws an error, the output looks like this (in development):
[1709901000200] ERROR (12345): unhandled error
    reqId: "dfe66a12-1bc0-4ba7-8a52-03ad08d3a0c6"
    err: {
      "message": "something went wrong",
      "stack": "Error: something went wrong
          at handler (/app/src/index.ts:15:11)
          at dispatch (/app/node_modules/hono/dist/compose.js:40:23)"
    }
[1709901000202] ERROR (12345): request errored
    reqId: "dfe66a12-1bc0-4ba7-8a52-03ad08d3a0c6"
    req: {
      "method": "GET",
      "url": "/users/123"
    }
    res: {
      "statusCode": 500
    }
    err: {
      "message": "failed with status code 500"
    }
    responseTime: 4
The first entry is from the app.onError handler. The second is pino-http’s automatic request completion log, which uses the error level here because of our customLogLevel configuration.
When logs aren’t enough
When you’re tracking down a bug, you usually need more than a status code and a response time. You need the request body that triggered the error, the response your API sent back, the headers on both sides. Structured logs don’t capture that. You could add it, but logging full payloads through Pino is impractical at scale. It creates volume, requires masking of sensitive fields, and isn’t easy to search.
Introducing Apitally
Apitally fills this gap. It’s an API monitoring tool that captures request and response data, including headers and payloads, and makes it searchable on a user-friendly dashboard. You can choose exactly what to log, sensitive fields are masked automatically, and application logs show up next to the request that produced them.
To get started, install the Apitally SDK for Hono.
npm install apitally
Then, add the Apitally middleware to your Hono app.
import { Hono } from "hono";
import { useApitally } from "apitally/hono";

const app = new Hono();

useApitally(app, {
  clientId: "your-client-id",
  env: "dev",
  requestLogging: {
    enabled: true,
    captureLogs: true,

    # Configure what's included in request logs (disabled by default)
    logRequestHeaders: true,
    logRequestBody: true,
    logResponseBody: true,

    # Optional: mask additional headers and body fields using regex
    maskHeaders: [/^X-Sensitive-Header$/],
    maskBodyFields: [/^sensitive_field$/],
  },
});
Check out the SDK reference for all available parameters and default masking patterns.
With this configuration, the Apitally SDK automatically captures request and application logs, stores them in a temporary file, and periodically flushes them to Apitally’s servers. All this happens asynchronously to not affect your app’s performance.
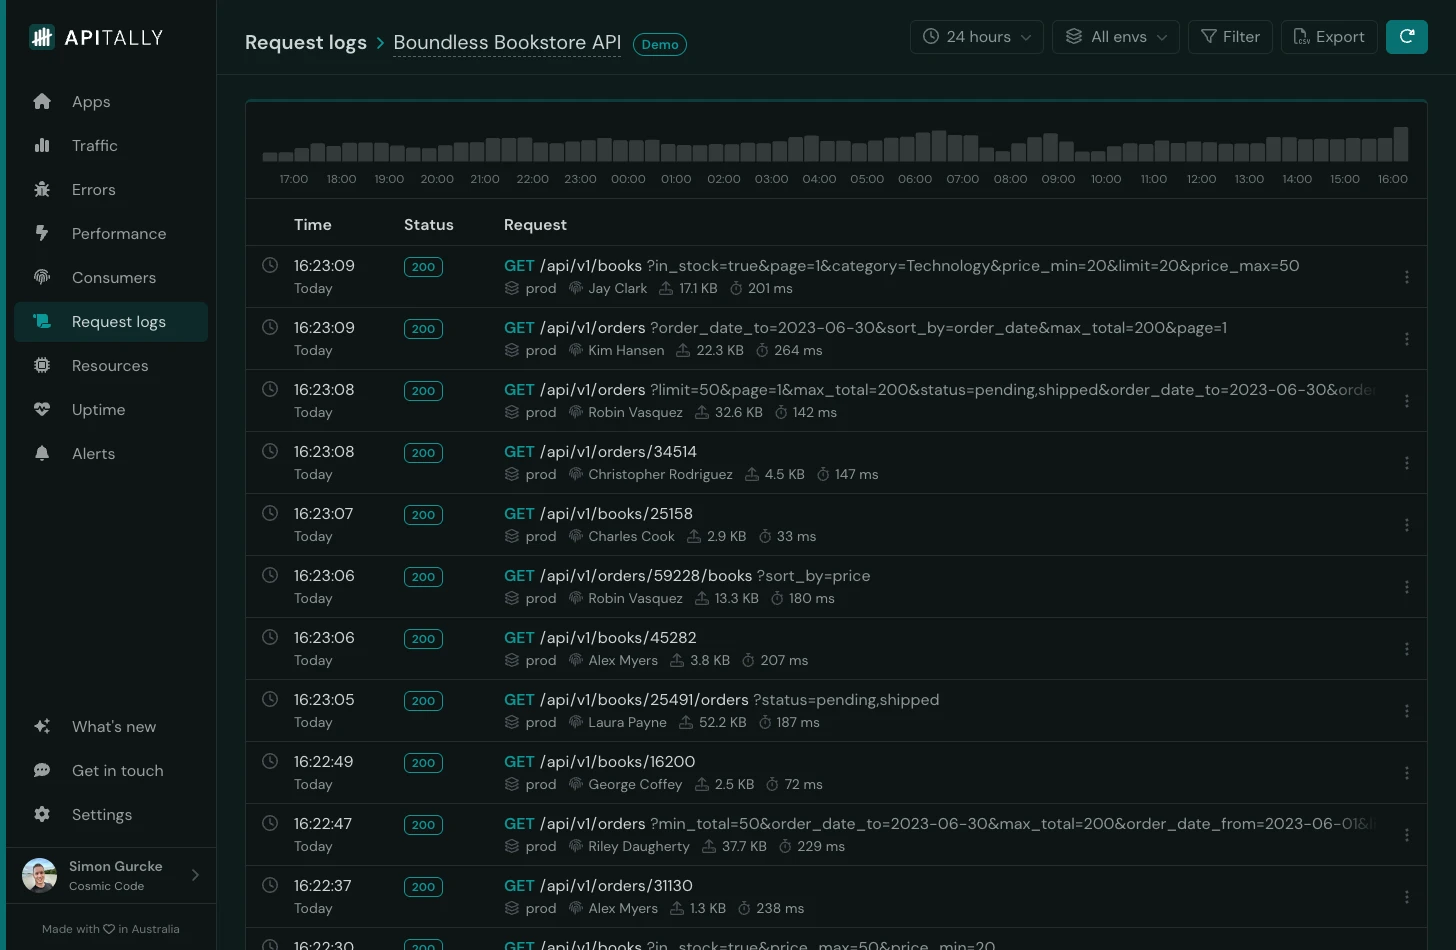
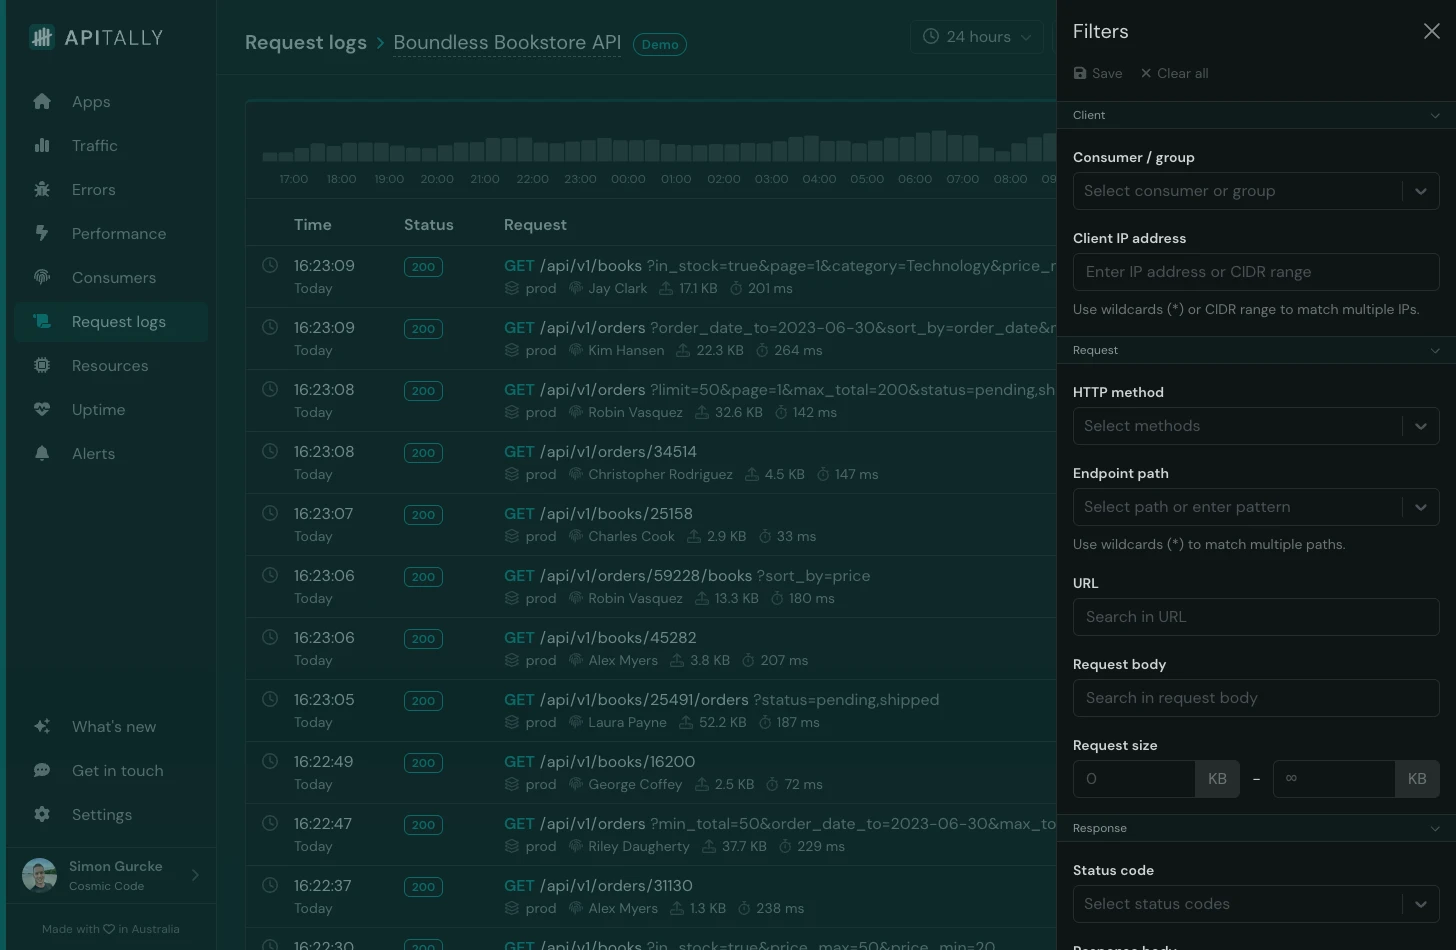
You can then find and inspect the logs in the Apitally dashboard, with various filtering options. For example, you can filter by:
- Consumer or client IP address
- HTTP method, request URL or response status code
- Request and response body (free text search)
- Response time (find slow requests)
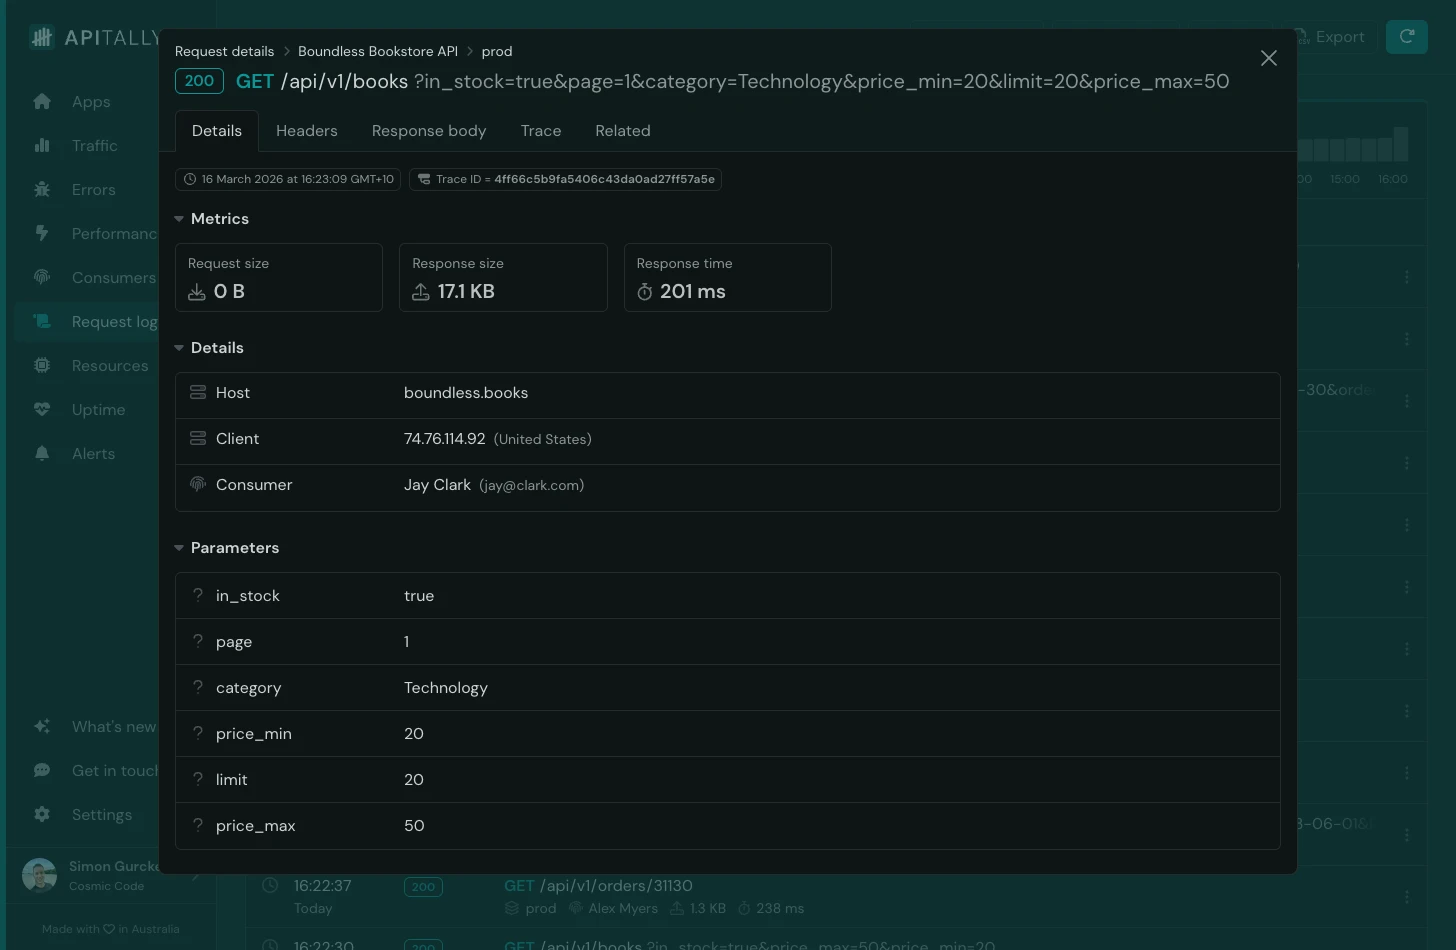
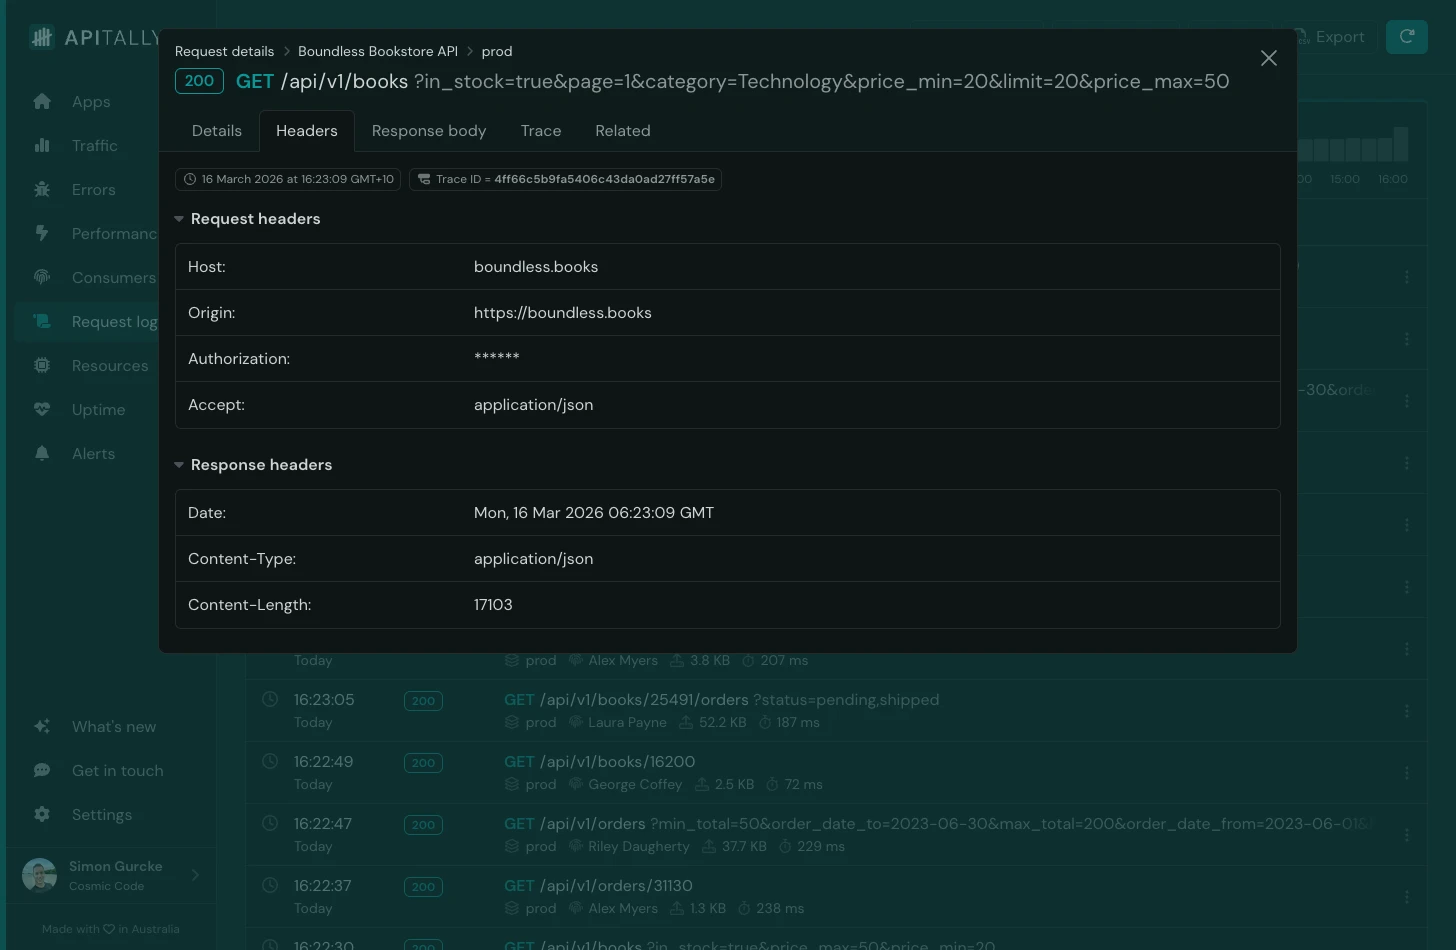
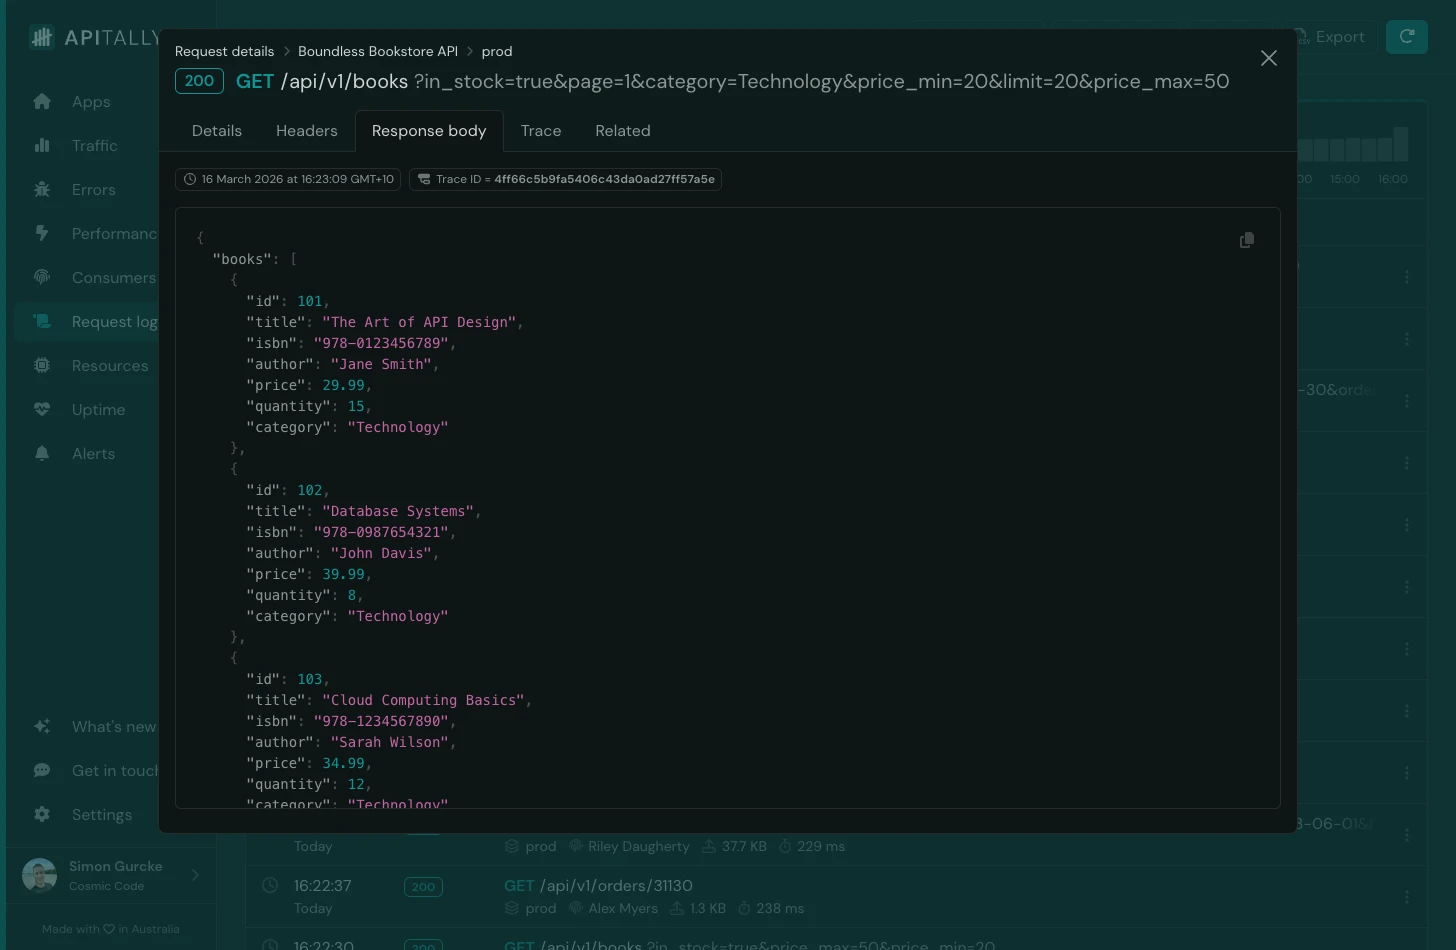
Clicking on a request in the logs brings up rich details, including:
- Path and query parameters
- Headers (with sensitive headers masked automatically)
- Request and response bodies (supports text and JSON up to 50 KB)
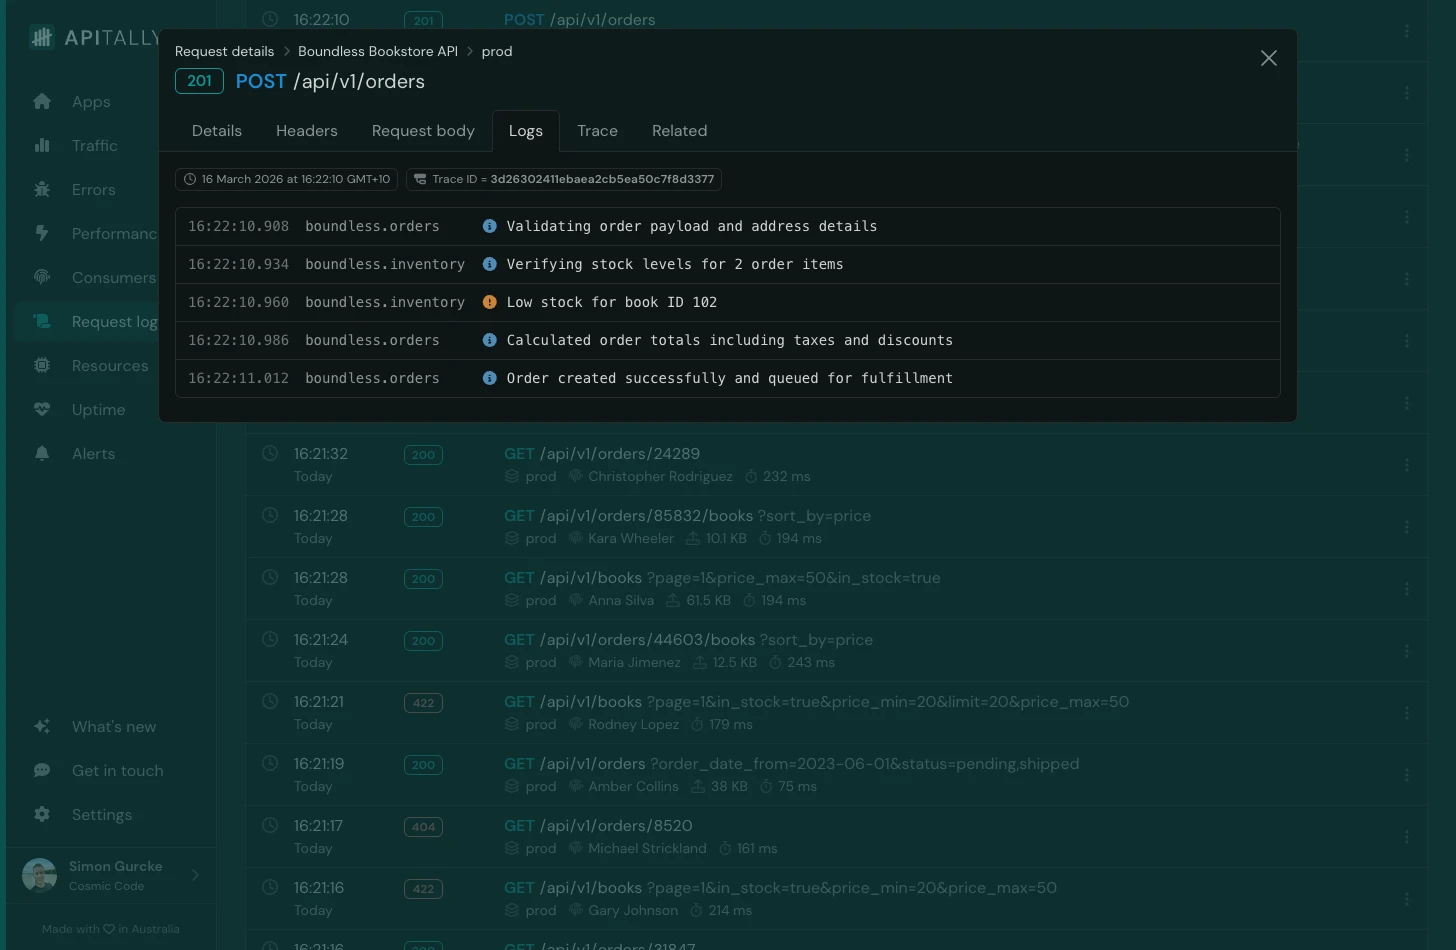
- Correlated application logs and traces
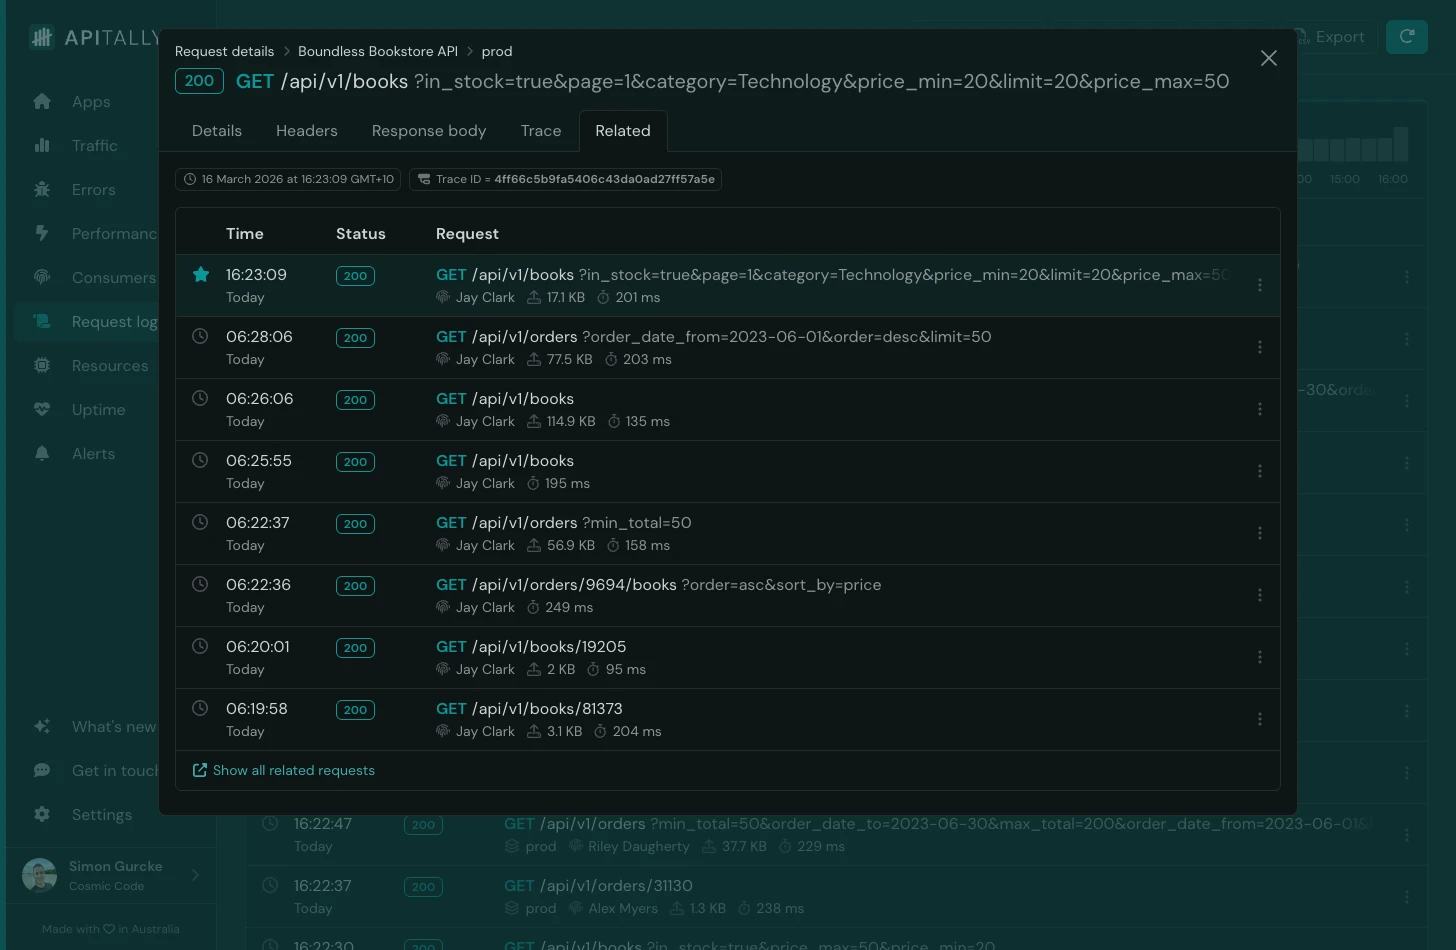
- List of related requests from the same client
Apitally stores log data in a ClickHouse database hosted in the US and retains it for 15 days. Log volume limits apply based on the pricing tier, with the lowest tier allowing 1 million requests per month. The highest tier includes 25 million requests and users can enable usage-based pricing to go beyond that limit.
Check out the docs to learn more about request logs in Apitally, and the Hono setup guide for more details on configuration options, consumer tracking, and tracing.
Conclusion
Hono’s built-in logger is fine for development, but too limited for production. A custom middleware with structured JSON output and request ID correlation covers the basics. For a more complete setup, pino-http gives you better performance, log levels, a context-bound logger, and configurable transports.
When debugging requires more than log entries, Apitally captures and indexes full request and response data, making it easy to find and inspect individual API calls along with correlated log messages. Its SDK for Hono automates the capture pipeline and is ready for production with minimal configuration.