API metrics, logs and now traces in one simple tool
Apitally now supports tracing, eliminating guesswork when troubleshooting slow API requests, while keeping things simple.

Today we’re announcing the release of our tracing feature, which marks a significant milestone for Apitally. Together with metrics and logs, Apitally now covers the three core pillars of API observability in one easy-to-use tool.
From day one, Apitally’s mission has been to make API observability simple. It started with API metrics and analytics, then expanded to request logging and correlated application logs. With the addition of tracing, the picture is now complete.
Finding the root cause of slow requests
Apitally already provides detailed performance metrics to identify latency issues. Request logs then allow you to inspect individual slow API requests. What’s been missing so far is visibility into where time was actually spent during request handling.
This is where tracing comes in. A trace consists of one or more spans, each representing an operation that occurred during request handling, along with the time spent on that operation. With the right instrumentation, you can immediately see whether the bottleneck is a slow database query, a slow external API call, or another part of your code.
How it works
Under the hood, Apitally uses OpenTelemetry to capture spans and attaches them to request logs. This means you can use standard OpenTelemetry instrumentation packages for your libraries, as well as the OpenTelemetry API to create your own spans. Our Python SDK also provides helper functions to make instrumenting popular libraries and creating custom spans even easier.
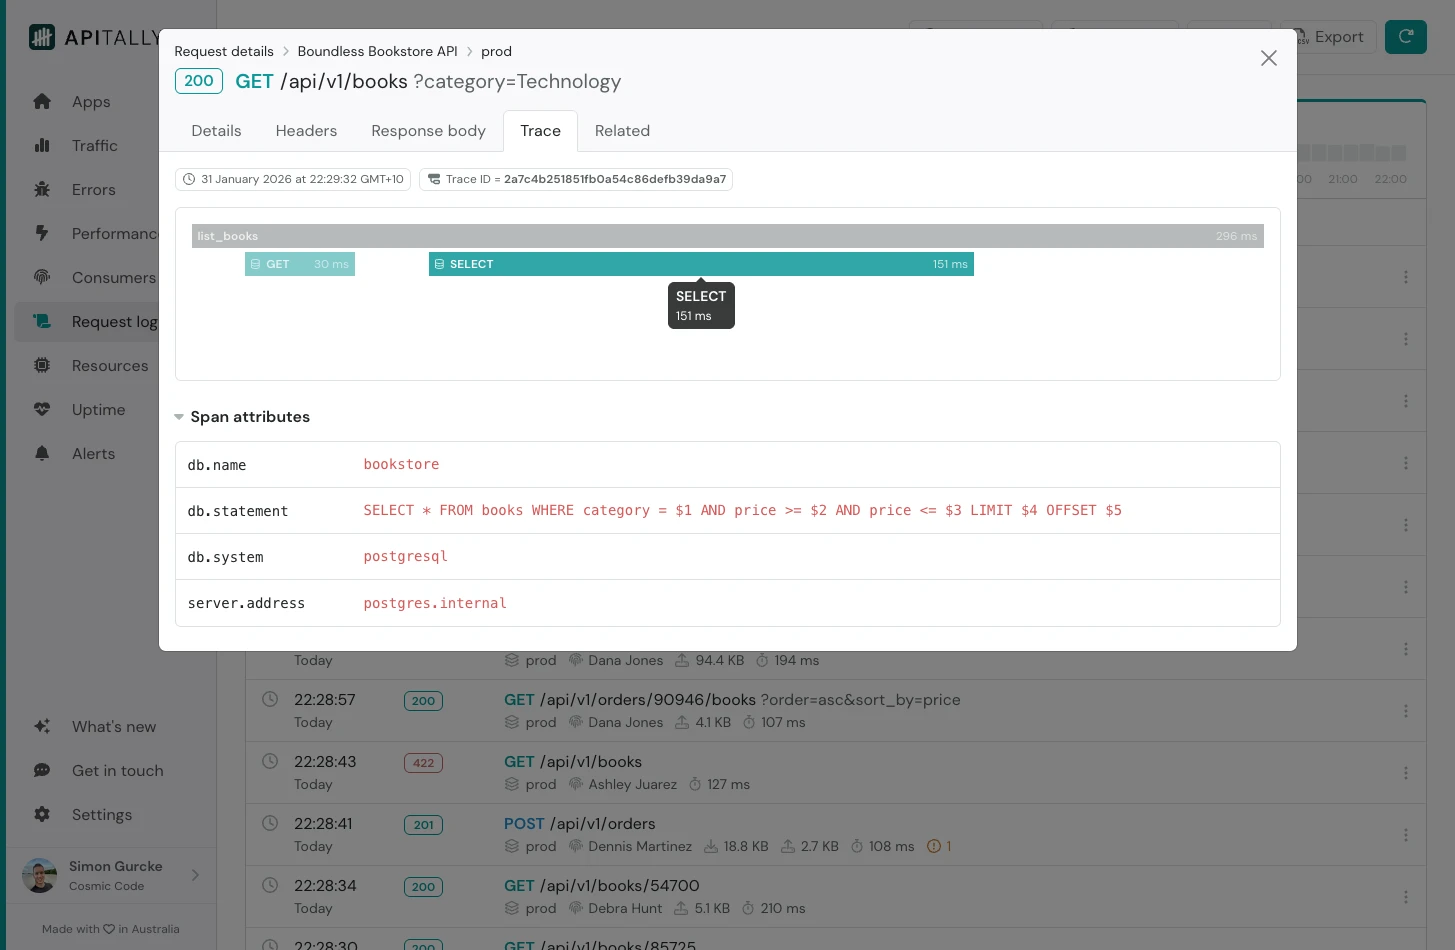
Once configured, you’ll find a Trace tab in the request details view with a visualization showing spans as horizontal bars. The width of each bar reflects its duration relative to the total response time.
You can click on a span to view its attributes. These typically include the SQL statement for database queries or the request URL for HTTP calls, among other details.
Availability and usage limits
Tracing is now available for Python, JavaScript, .NET, and Go.
The feature is included in our Starter and Premium plans. The Starter plan includes up to 10 million spans per month. The Premium plan includes 50 million. Usage-based billing can be enabled to go beyond these limits if needed.
Getting started
Check out our tracing instrumentation guides for Python, JavaScript, .NET, or Go.
If you have feedback or ideas for improvements, we’d love to hear from you.