FastAPI monitoring made easy
Understand how your API is being used and how it's performing without deploying, configuring and maintaining complex monitoring tools.

I’ve always found that setting up monitoring for my FastAPI applications was more complex than it needed to be. I wanted a tool that was as easy to use as FastAPI itself, which is why I built Apitally: a simple API monitoring and analytics tool that works seamlessly with FastAPI and is effortless to set up.
The term ‘monitoring’ can be a bit vague, so here’s a quick summary of what Apitally actually helps you to do:
- Understand API traffic, usage and adoption
- Track client and server errors
- Analyze API performance (i.e. response times)
- Log, find and inspect individual API requests and responses, and see correlated application logs
- Monitor API uptime with synthetic health checks and heartbeats
- Get notified when something goes wrong using custom alerts
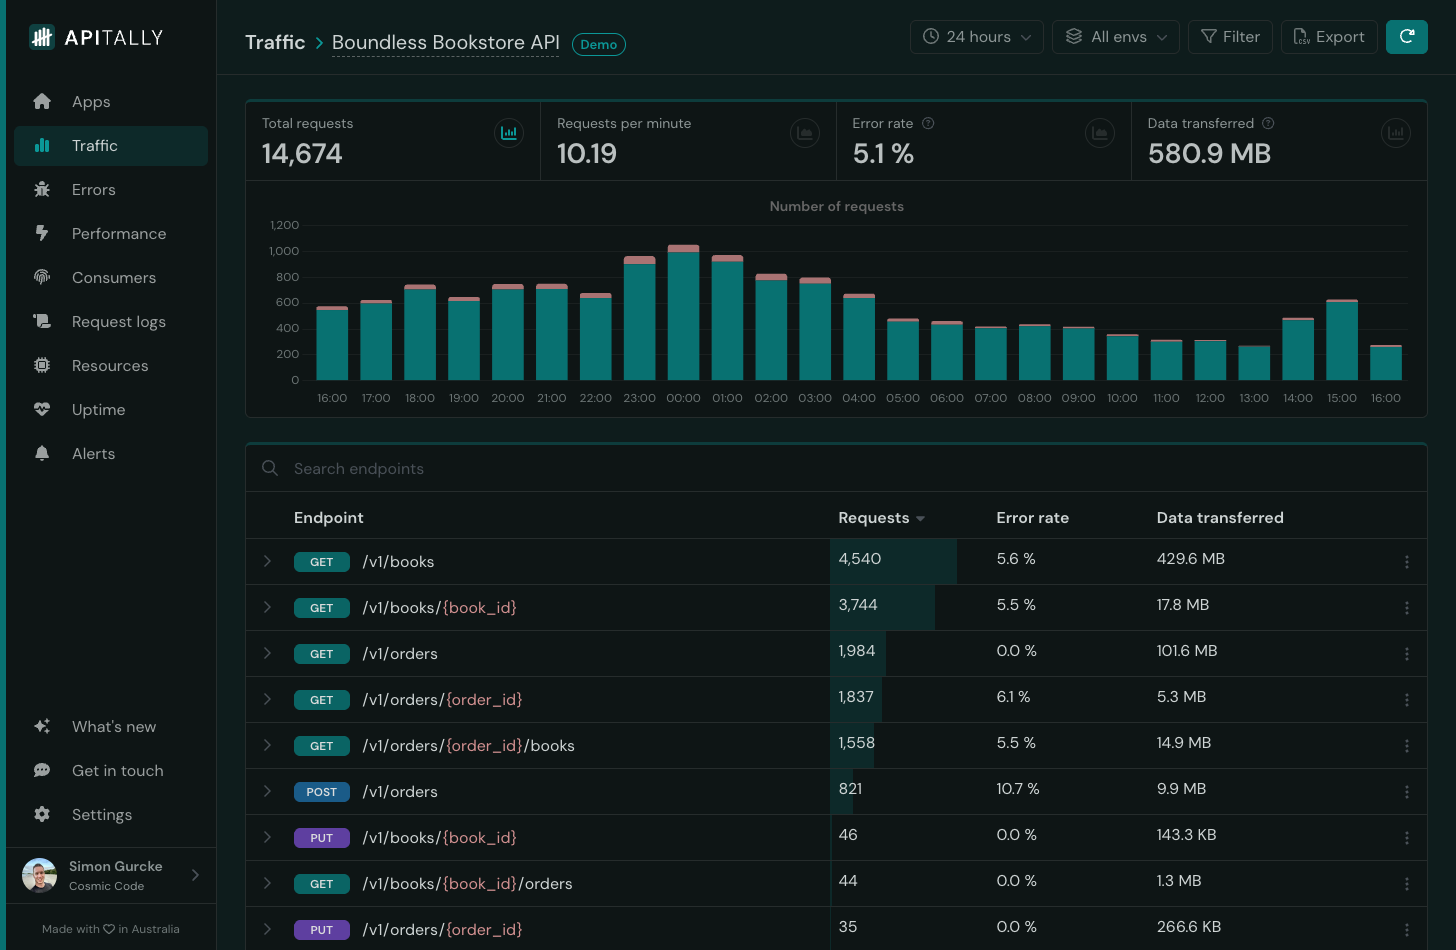
Dashboards
One key difference to other tools is that Apitally is built specifically for monitoring REST APIs, while keeping things simple and easy to use. It comes with intuitive API monitoring dashboards out of the box, so you don’t have to spend time building your own.
The dashboards provide a clear overview of what’s happening with your API, while allowing you to drill down into any area of interest.
How it works
Apitally’s open-source SDK integrates with FastAPI using a lightweight middleware, which automatically captures metrics and logs for each API request and response. Metrics are aggregated client-side and data is sent to the Apitally dashboard asynchronously, without affecting your application’s performance.
By default, Apitally doesn’t capture any sensitive data, making it suitable for environments with strict privacy requirements. If you enable request logging, you can configure it to meet your specific needs.
Getting started
Setting Apitally up for your FastAPI project only takes a few minutes.
-
First, grab your client ID by signing up and creating an app in the Apitally dashboard.
-
Then, install the
apitallypackage with thefastapiextra in your project:
pip install "apitally[fastapi]"
- Finally, add the Apitally middleware to your app by copying and pasting a few lines of code, including your client ID:
from fastapi import FastAPI
from apitally.fastapi import ApitallyMiddleware

app = FastAPI()
app.add_middleware(
    ApitallyMiddleware,
    client_id="your-client-id",  # provided in Apitally dashboard
    env="prod",  # or "dev" etc.

    # Optionally enable and configure request logging
    enable_request_logging=True,
    log_request_headers=True,
    log_request_body=True,
    log_response_body=True,
    capture_logs=True,
)
After deploying your application, you should start seeing data in the Apitally dashboard within a few seconds.
Identifying consumers
Apitally allows you to track API usage per consumer.
To enable this, you can associate requests with consumers using the set_consumer function.
You could do this anywhere within your existing authentication code, or in a dedicated dependency, like in the example below.
from typing import Annotated
from fastapi import FastAPI, Depends, Request
from apitally.fastapi import set_consumer

def identify_consumer(request: Request, current_user: Annotated[User, Depends(get_current_user)]) -> None:
    set_consumer(
        request,
        identifier=current_user.user_id,
        name=current_user.name,  # optional
        group=current_user.group,  # optional
    )

app = FastAPI(dependencies=[Depends(identify_consumer)])
Conclusion
Monitoring your FastAPI application shouldn’t be a complex, time-consuming task. Apitally provides the essential insights you need with minimal effort, letting you focus on building your API.
This post covered the basics to get you started. For further instructions check out our detailed setup guide for FastAPI.
Happy monitoring!