A complete guide to logging in FastAPI
How to configure logging for FastAPI and Uvicorn, from basic setup and correlation IDs to structured output with structlog or Loguru.
Logging is critical for understanding and debugging FastAPI apps in production. When things go wrong, logs are usually the best starting point for any investigation.
For APIs, logging can be broken down into two categories: request logs, which record individual API requests and responses, and application logs, which contain detailed messages from your application’s code. Ideally, both types of logs are correlated, meaning each log record is linked to the API request.
This article covers how to set up logging in a FastAPI application, from basic configuration with Python’s logging module to structured output with structlog or Loguru. I’ll also introduce Apitally as a simple solution for capturing detailed request logs and correlated application logs.
Python’s standard logging library
Python’s logging module is part of the standard library and is usually all you need for application logging in FastAPI.
The standard pattern is to create one logger per module using getLogger(__name__):
import logging

logger = logging.getLogger(__name__)
__name__ resolves to the module’s fully qualified name (e.g. myapp.routes.users), which makes it easy to identify where a log message came from. Loggers form a hierarchy based on dot-separated names, and log records propagate up from child loggers to their parents.
Before you can see any output, you need to configure at least the root logger. The simplest way is basicConfig:
logging.basicConfig(
    level=logging.INFO,
    format="%(asctime)s [%(name)s] %(levelname)s: %(message)s",
)
One common gotcha: without this configuration, calls to logger.info() or logger.debug() produce no output. The root logger defaults to WARNING level, so anything below that is silently dropped. If your log messages aren’t showing up, this is almost always the reason.
Python defines five standard log levels:
| Level | When to use |
|---|---|
DEBUG | Detailed diagnostic info, typically only useful during development |
INFO | Confirmation that things are working as expected |
WARNING | Something unexpected happened, but the application still works |
ERROR | A more serious problem; some functionality failed |
CRITICAL | A severe error; the program may not be able to continue |
For more complex setups with multiple handlers, filters, or per-logger configuration, you can use logging.config.dictConfig(). We’ll see an example of that in the log correlation section below.
Uvicorn’s built-in access logs
If you’re using Uvicorn to run your FastAPI app, you get basic request logging in your console out of the box. Each request produces a line like this:
INFO: 127.0.0.1:52345 - "GET /hello HTTP/1.1" 200
Under the hood, Uvicorn maintains three loggers: uvicorn (the parent), uvicorn.error (for server lifecycle and error messages), and uvicorn.access (for request logs). These are standard Python loggers, but they’re configured independently from your application’s loggers.
This is an important distinction. The --log-level CLI flag only controls Uvicorn’s own loggers, not your application’s. If you set --log-level debug, Uvicorn will log more verbose output, but your logger.info() calls still won’t show up unless you’ve configured your root logger separately.
If you’re adding custom request logging middleware (as we’ll do in the next section), you’ll want to disable Uvicorn’s access logs to avoid duplicate output. You can do this with the --no-access-log CLI flag or by passing access_log=False to uvicorn.run().
Custom request logging middleware
Uvicorn’s access logs are limited: no timestamps, no response times, and no easy way to add custom fields. A custom middleware gives you full control over what gets logged for each request.
Here’s a simple FastAPI app with a middleware that logs the HTTP method, path, status code, and response time:
import logging
import time
from fastapi import FastAPI, Request

logging.basicConfig(
    level=logging.INFO,
    format="%(asctime)s [%(name)s] %(levelname)s: %(message)s",
)
logger = logging.getLogger(__name__)

app = FastAPI(title="Example API")

@app.middleware("http")
async def log_requests(request: Request, call_next):
    start_time = time.perf_counter()
    response = await call_next(request)
    response_time = time.perf_counter() - start_time
    logger.info(f"{request.method} {request.url.path} {response.status_code} {response_time:.3f}s")
    return response

@app.get("/hello")
async def say_hello():
    logger.info("Saying hello")
    return {"message": "Hello!"}
The middleware logs request details after the route handler returns. Note that we’ve also added a “Saying hello” log message in the route handler, which helps us demonstrate log correlation in the next section.
Log correlation with asgi-correlation-id
When two requests are processed concurrently, the log output could look like this:
2025-09-30 14:29:00,123 [main] INFO: Saying hello
2025-09-30 14:29:00,123 [main] INFO: Saying hello
2025-09-30 14:29:00,124 [main] INFO: GET /hello 200 0.001s
2025-09-30 14:29:00,124 [main] INFO: GET /hello 200 0.001s
As you can see, there is no way to tell which “Saying hello” message belongs to which request. Not a big deal in this simple example, but essential when debugging production issues, especially with high request volumes.
To link log messages with requests, we need a correlation ID. The asgi-correlation-id package serves exactly this purpose.
pip install asgi-correlation-id
The package provides a middleware that generates a unique correlation ID for each incoming request. If the request already includes a correlation ID header, it reuses that value, which lets you trace requests across services.
In addition to adding that middleware to our app, we also need to configure a log filter and include the correlation ID in our log format. This can’t be done using basicConfig, so we use the more verbose but flexible dictConfig instead.
import logging.config
import time
from asgi_correlation_id import CorrelationIdMiddleware
from fastapi import FastAPI, Request

logging.config.dictConfig({
    "version": 1,
    "disable_existing_loggers": False,
    "filters": {
        "correlation_id": {
            "()": "asgi_correlation_id.CorrelationIdFilter",
            "uuid_length": 32,
            "default_value": "-",
        },
    },
    "formatters": {
        "standard": {
            "format": "%(asctime)s [%(correlation_id)s] [%(name)s] %(levelname)s: %(message)s",
        },
    },
    "handlers": {
        "console": {
            "class": "logging.StreamHandler",
            "filters": ["correlation_id"],
            "formatter": "standard",
        },
    },
    "root": {
        "level": "INFO",
        "handlers": ["console"],
    },
})
logger = logging.getLogger(__name__)

app = FastAPI()

@app.middleware("http")
async def log_requests(request: Request, call_next):
    start_time = time.perf_counter()
    response = await call_next(request)
    response_time = time.perf_counter() - start_time
    logger.info(f"{request.method} {request.url.path} {response.status_code} {response_time:.3f}s")
    return response

# Add CorrelationIdMiddleware after log_requests so it runs first
app.add_middleware(CorrelationIdMiddleware)

@app.get("/hello")
async def say_hello():
    logger.info("Saying hello")
    return {"message": "Hello!"}
If we made two concurrent requests to our API again, we’d get the following output. You can see how the correlation IDs allow us to tell which messages belong together.
2025-09-30 14:36:00,123 [50e2646d5e594cb197ae9f3d21de7a57] [main] INFO: Saying hello
2025-09-30 14:36:00,123 [e986f5451c4b4e0fb7fea90dda32608f] [main] INFO: Saying hello
2025-09-30 14:36:00,124 [50e2646d5e594cb197ae9f3d21de7a57] [main] INFO: GET /hello 200 0.001s
2025-09-30 14:36:00,124 [e986f5451c4b4e0fb7fea90dda32608f] [main] INFO: GET /hello 200 0.001s
Custom error logging
When an unhandled exception occurs in a route handler, FastAPI’s built-in ServerErrorMiddleware catches it and lets Uvicorn log the traceback. But you may want more control over how errors are logged, especially if you’re using a custom log format or correlation IDs.
The logger.exception() method logs a message at ERROR level and automatically includes the full traceback. It must be called inside an except block.
Here’s a middleware that catches unhandled exceptions and logs them before re-raising:
@app.middleware("http")
async def log_exceptions(request: Request, call_next):
    try:
        return await call_next(request)
    except Exception:
        logger.exception(f"Unhandled exception for {request.method} {request.url.path}")
        raise
With the correlation ID setup from the previous section, the error log would look like this:
2025-09-30 14:40:00,456 [50e2646d5e594cb197ae9f3d21de7a57] [main] ERROR: Unhandled exception for GET /hello
Traceback (most recent call last):
  File "main.py", line 25, in say_hello
    result = 1 / 0
ZeroDivisionError: division by zero
The correlation ID lets you find all related log messages for the same request and trace what happened leading up to the error.
Structured JSON logging
Everything so far produces plain text output. That’s easy to read in a terminal, but in production you typically ship logs to a log aggregation service like CloudWatch, Datadog, Grafana Loki, or the ELK stack. These tools work best with structured logs: JSON objects with consistent, named fields that can be indexed and queried directly. With plain text, you need custom parsing rules that are fragile and break when the log format changes.
The simplest way to get JSON output from Python’s standard logging module is the python-json-logger package. It provides a drop-in Formatter replacement that outputs JSON instead of plain text.
pip install python-json-logger
import logging
from pythonjsonlogger.json import JsonFormatter

formatter = JsonFormatter(
    # Fields to include in JSON output
    ["asctime", "levelname", "name", "message"],
    # Use more conventional field names
    rename_fields={"asctime": "timestamp", "levelname": "level", "name": "logger"},
)
handler = logging.StreamHandler()
handler.setFormatter(formatter)
logging.basicConfig(level=logging.INFO, handlers=[handler])
Any keyword arguments you pass via extra are included as fields in the JSON output:
logger.info("User logged in", extra={"user_id": 42, "ip": "192.168.1.1"})
{"timestamp": "2025-09-30 14:36:00,123", "level": "INFO", "logger": "main", "message": "User logged in", "user_id": 42, "ip": "192.168.1.1"}
python-json-logger is purely a formatter. If you want a more complete structured logging library, structlog is a popular choice.
Logging with structlog
structlog goes beyond just formatting output as JSON. It introduces bound loggers that carry context across calls, a processor pipeline that transforms each log entry through a chain of functions, and built-in renderers for both colored console output during development and JSON in production.
pip install structlog
Since FastAPI and Uvicorn use stdlib logging internally, the recommended approach is to route structlog’s output through stdlib too. structlog provides a ProcessorFormatter for this, a stdlib Formatter that runs log records through structlog’s processor pipeline before rendering them. That way both structlog and stdlib log records produce consistent output.
The integration between structlog and stdlib logging is a bit fiddly and verbose, so it’s best to put it into a dedicated setup function.
import logging
import structlog


def setup_logging(json_logs: bool = False):
    # Processors run on every log entry in order
    shared_processors = [
        structlog.contextvars.merge_contextvars,  # include request-scoped context
        structlog.stdlib.add_log_level,
        structlog.stdlib.add_logger_name,
        structlog.processors.TimeStamper(fmt="iso"),
        structlog.processors.StackInfoRenderer(),
        structlog.processors.format_exc_info,
    ]
    structlog.configure(
        processors=[
            *shared_processors,
            # Pass processed event dict to stdlib for rendering
            structlog.stdlib.ProcessorFormatter.wrap_for_formatter,
        ],
        # Output through stdlib logging
        logger_factory=structlog.stdlib.LoggerFactory(),
        wrapper_class=structlog.stdlib.BoundLogger,
        cache_logger_on_first_use=True,
    )

    # JSON for production, colored console output for development
    renderer = (
        structlog.processors.JSONRenderer()
        if json_logs else structlog.dev.ConsoleRenderer()
    )
    formatter = structlog.stdlib.ProcessorFormatter(
        processors=[
            structlog.stdlib.ProcessorFormatter.remove_processors_meta,
            renderer,
        ],
        # Run shared processors on stdlib logs
        foreign_pre_chain=shared_processors,
    )

    # Attach the formatter to stdlib's root logger
    handler = logging.StreamHandler()
    handler.setFormatter(formatter)
    logging.basicConfig(level=logging.INFO, handlers=[handler], force=True)

    # Let uvicorn's logs propagate so they go through structlog too
    for name in ("uvicorn", "uvicorn.error"):
        logging.getLogger(name).handlers = []
        logging.getLogger(name).propagate = True
If you use uvicorn.run(), pass log_config=None to prevent Uvicorn from overwriting your logging setup again.
Now let’s implement a request logging middleware like the one from earlier, but using structlog instead of stdlib logging. The CorrelationIdMiddleware from asgi-correlation-id (introduced earlier) provides the correlation ID, which we bind to structlog’s context, so it’s automatically included in every log entry.
import os
import time
import structlog
from asgi_correlation_id import CorrelationIdMiddleware, correlation_id
from structlog.contextvars import bind_contextvars, clear_contextvars
from fastapi import FastAPI, Request

# Set up logging with structlog
is_production = os.environ.get("ENV") == "production"
setup_logging(json_logs=is_production)

# Create logger (one per module)
logger = structlog.get_logger()

app = FastAPI()

@app.middleware("http")
async def log_requests(request: Request, call_next):
    # Bind correlation ID to the context
    clear_contextvars()
    bind_contextvars(correlation_id=correlation_id.get())

    # Measure response time
    start_time = time.perf_counter()
    response = await call_next(request)
    response_time = time.perf_counter() - start_time

    # Log request details
    logger.info(
        "request",
        method=request.method,
        path=request.url.path,
        status=response.status_code,
        response_time=f"{response_time:.3f}s",
    )

    return response

# Add CorrelationIdMiddleware after log_requests so it runs first
app.add_middleware(CorrelationIdMiddleware)

@app.get("/hello")
async def say_hello():
    logger.info("Saying hello")
    return {"message": "Hello!"}
When a request is handled, the console output in development looks like this:
2025-09-30T14:36:00.123456Z [info     ] Saying hello                   [main] correlation_id=50e2646d5e594cb197ae9f3d21de7a57
2025-09-30T14:36:00.124012Z [info     ] request                        [main] correlation_id=50e2646d5e594cb197ae9f3d21de7a57 method=GET path=/hello status=200 response_time=0.001s
And in production you get JSON output like this instead:
{"event": "Saying hello", "correlation_id": "50e2646d5e594cb197ae9f3d21de7a57", "level": "info", "logger": "main", "timestamp": "2025-09-30T14:36:00.123456Z"}
{"event": "request", "method": "GET", "path": "/hello", "status": 200, "response_time": "0.001s", "correlation_id": "50e2646d5e594cb197ae9f3d21de7a57", "level": "info", "logger": "main", "timestamp": "2025-09-30T14:36:00.124012Z"}
Note that the correlation_id appears in both entries even though the route handler doesn’t pass it explicitly. That’s the merge_contextvars processor at work. It adds the values bound via bind_contextvars to every log entry for the duration of the request.
Logging with Loguru
While structlog is focused on structured logging, Loguru is a more general-purpose alternative to the standard logging module. It provides pretty colored console output and richer tracebacks for exceptions out of the box, among many other features. It also supports structured JSON output.
pip install loguru
Loguru comes with a pre-configured global logger that you can use directly, so you don’t need to create a logger instance for each module.
from loguru import logger
from fastapi import FastAPI

app = FastAPI()

@app.get("/hello")
async def say_hello():
    logger.info("Saying hello")
    return {"message": "Hello!"}
The challenge is that FastAPI and Uvicorn use Python’s standard logging internally. Without extra setup, you’ll have two separate logging systems with different output formats. To get consistent log output, you need an InterceptHandler that routes stdlib log records to Loguru.
import logging
import sys
from loguru import logger


class InterceptHandler(logging.Handler):
    def emit(self, record: logging.LogRecord) -> None:
        try:
            level: str | int = logger.level(record.levelname).name
        except ValueError:
            level = record.levelno
        frame, depth = logging.currentframe(), 2
        while frame and frame.f_code.co_filename == logging.__file__:
            frame = frame.f_back
            depth += 1
        logger.opt(depth=depth, exception=record.exc_info).log(level, record.getMessage())


def setup_logging():
    # Set Loguru's log level to INFO
    logger.remove()
    logger.add(sys.stderr, level="INFO")

    # Attach the intercept handler to the stdlib root logger
    logging.basicConfig(handlers=[InterceptHandler()], level=0, force=True)

    # Let uvicorn's logs propagate so they go through Loguru too
    for name in ("uvicorn", "uvicorn.access", "uvicorn.error"):
        logging.getLogger(name).handlers = []
        logging.getLogger(name).propagate = True
If you use uvicorn.run(), pass log_config=None to prevent Uvicorn from overwriting your logging setup again.
To get structured JSON output, you can pass serialize=True to logger.add(). For per-request context (like a correlation ID), you can use logger.contextualize() in a middleware.
Introducing Apitally
When you’re investigating an issue in production, you often need more than log messages and status codes. You need the request body that triggered the error, the response your API sent back, the headers on both sides. You could log all of that through your logging library, but it’s impractical: sensitive data needs careful masking, the volume adds up, and searching through log output for specific payloads isn’t great.
Apitally is a simple API monitoring and logging tool that captures request and response data, including headers and payloads, and makes it searchable on a dashboard. Application logs are captured and shown alongside each request, so you don’t need to set up log correlation manually. A single lightweight middleware replaces the need for asgi-correlation-id and custom request logging middleware.
The setup is minimal. Just install the Apitally SDK and add the middleware to your app:
pip install "apitally[fastapi]"
from fastapi import FastAPI
from apitally.fastapi import ApitallyMiddleware

app = FastAPI()
app.add_middleware(
    ApitallyMiddleware,
    client_id="your-client-id",
    env="dev",  # or "prod" etc.
    enable_request_logging=True,
    capture_logs=True,

    # Configure what's included in request logs (disabled by default)
    log_request_headers=True,
    log_request_body=True,
    log_response_body=True,

    # Optional: mask additional headers and body fields using regex
    mask_headers=[r"^X-Sensitive-Header$"],
    mask_body_fields=[r"^sensitive_field$"],
)
Check out the SDK reference for all available parameters and default masking patterns.
With this configuration, the Apitally SDK automatically captures request and application logs, stores them in a temporary file, and periodically flushes them to Apitally’s servers. All this happens asynchronously without affecting your app’s performance.
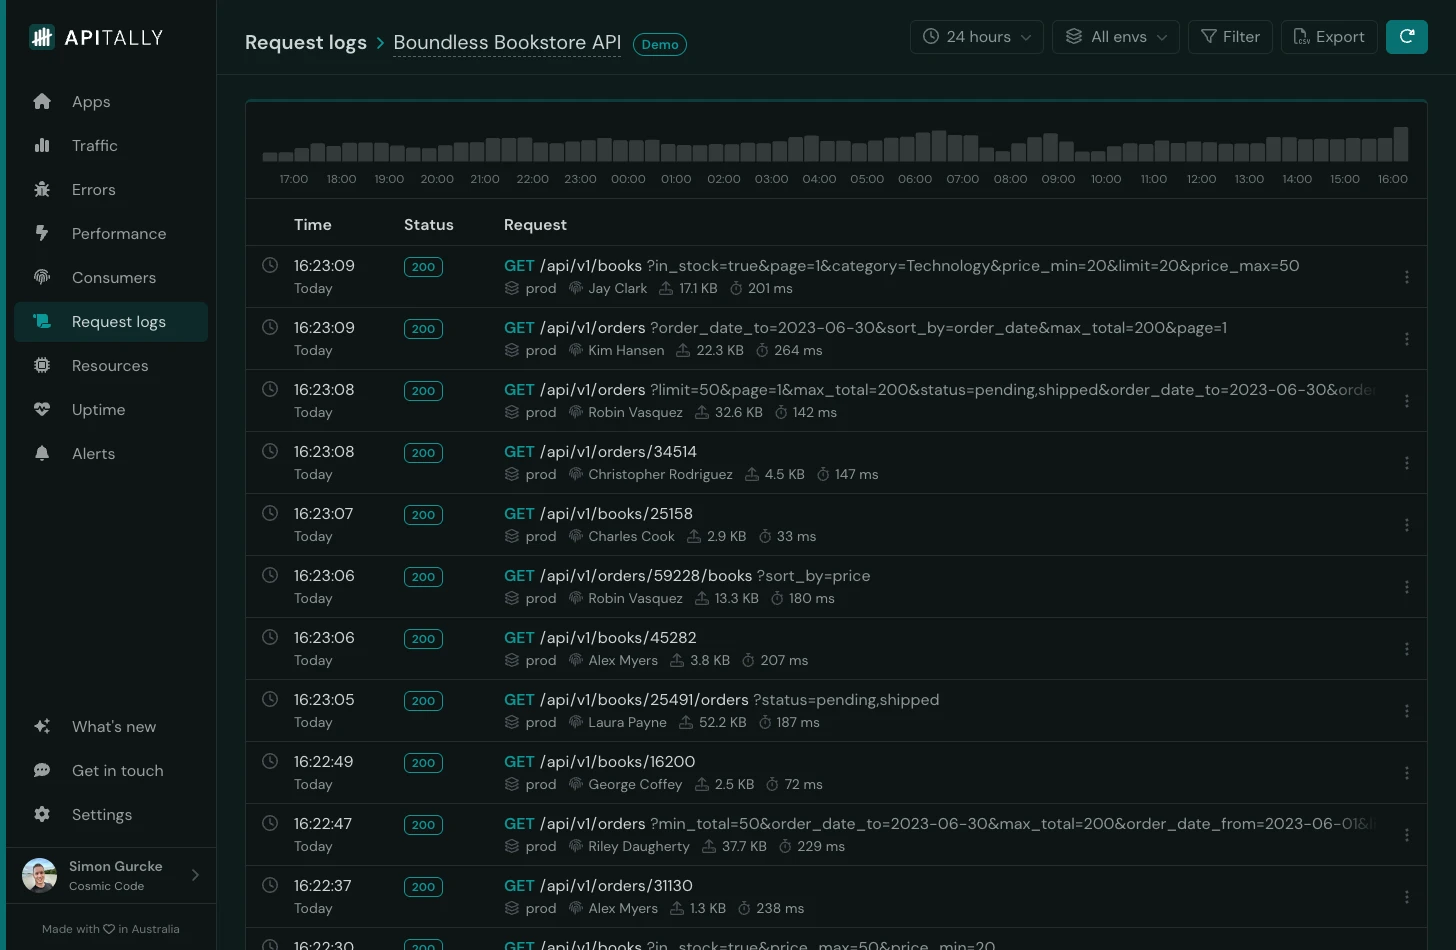
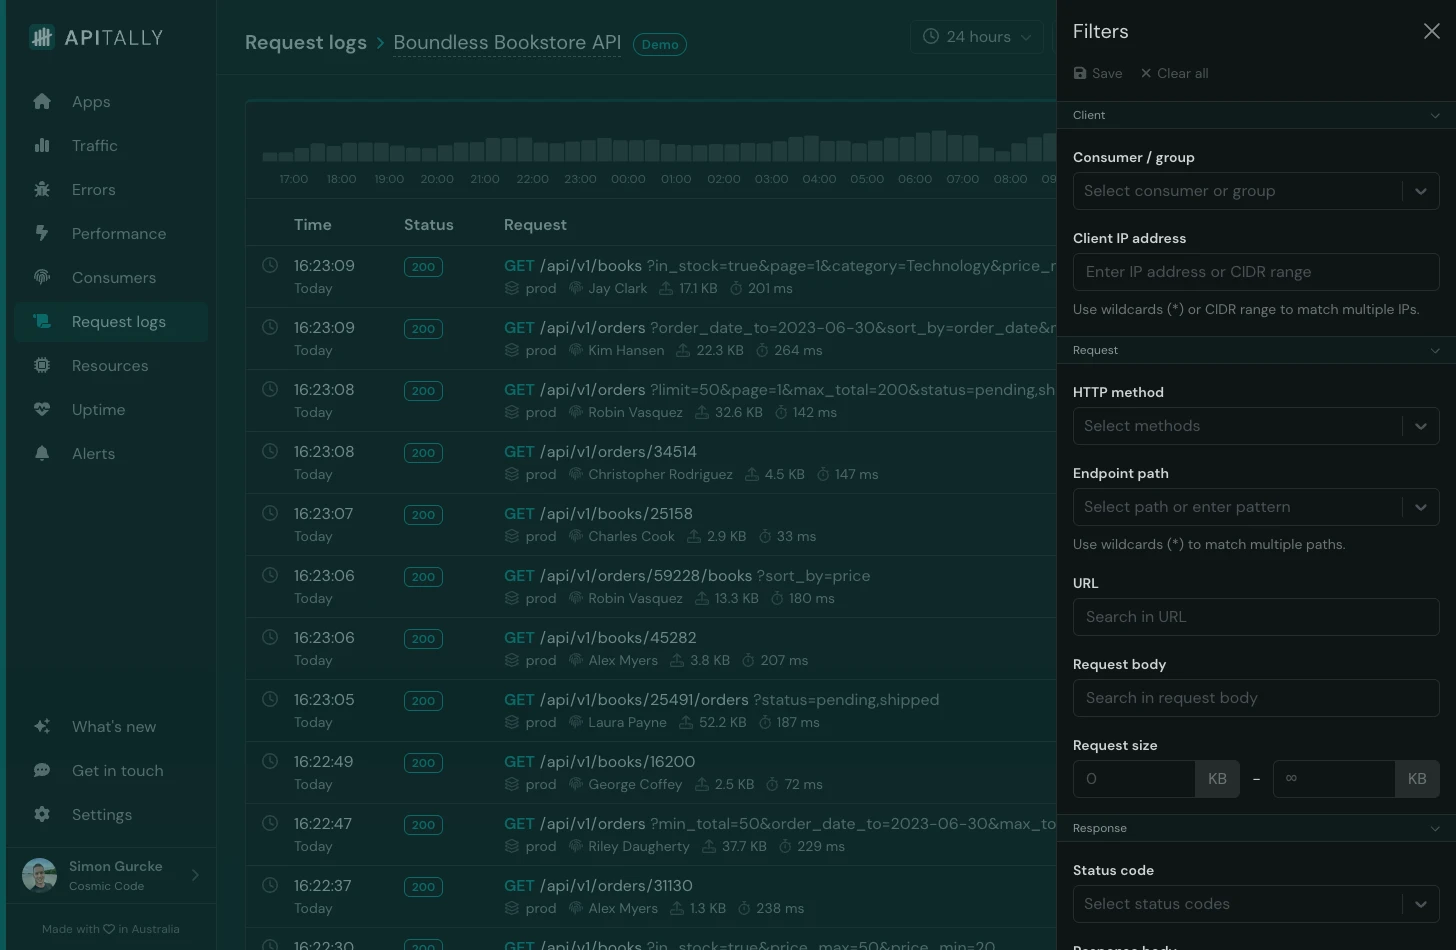
You can then find and inspect the logs in the Apitally dashboard, with various filtering options. For example, you can filter by:
- Consumer or client IP address
- HTTP method, request URL or response status code
- Request and response body (free text search)
- Response time (find slow requests)
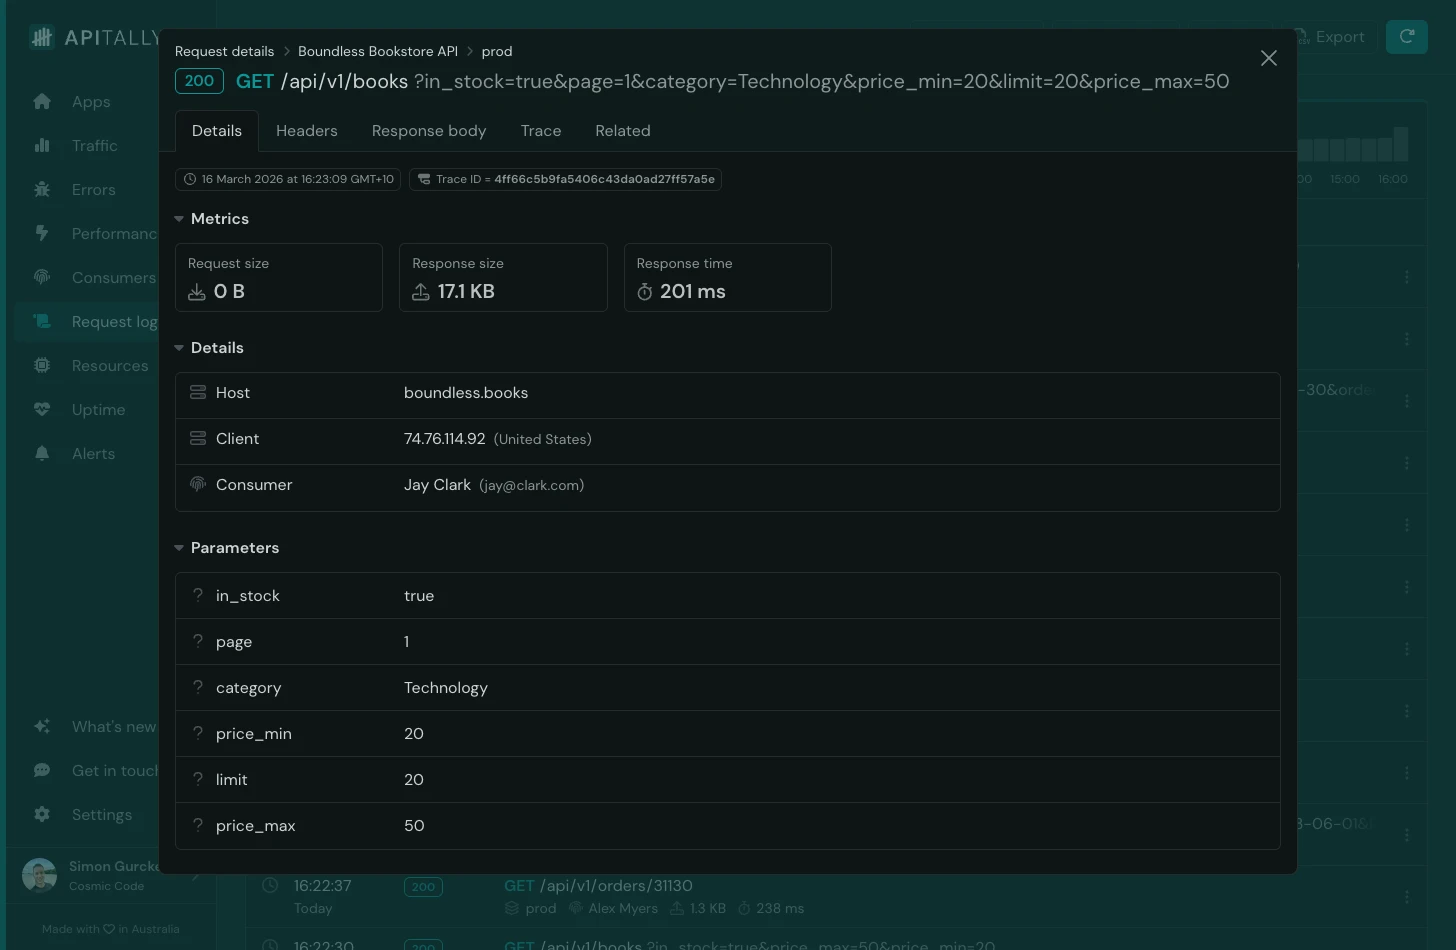
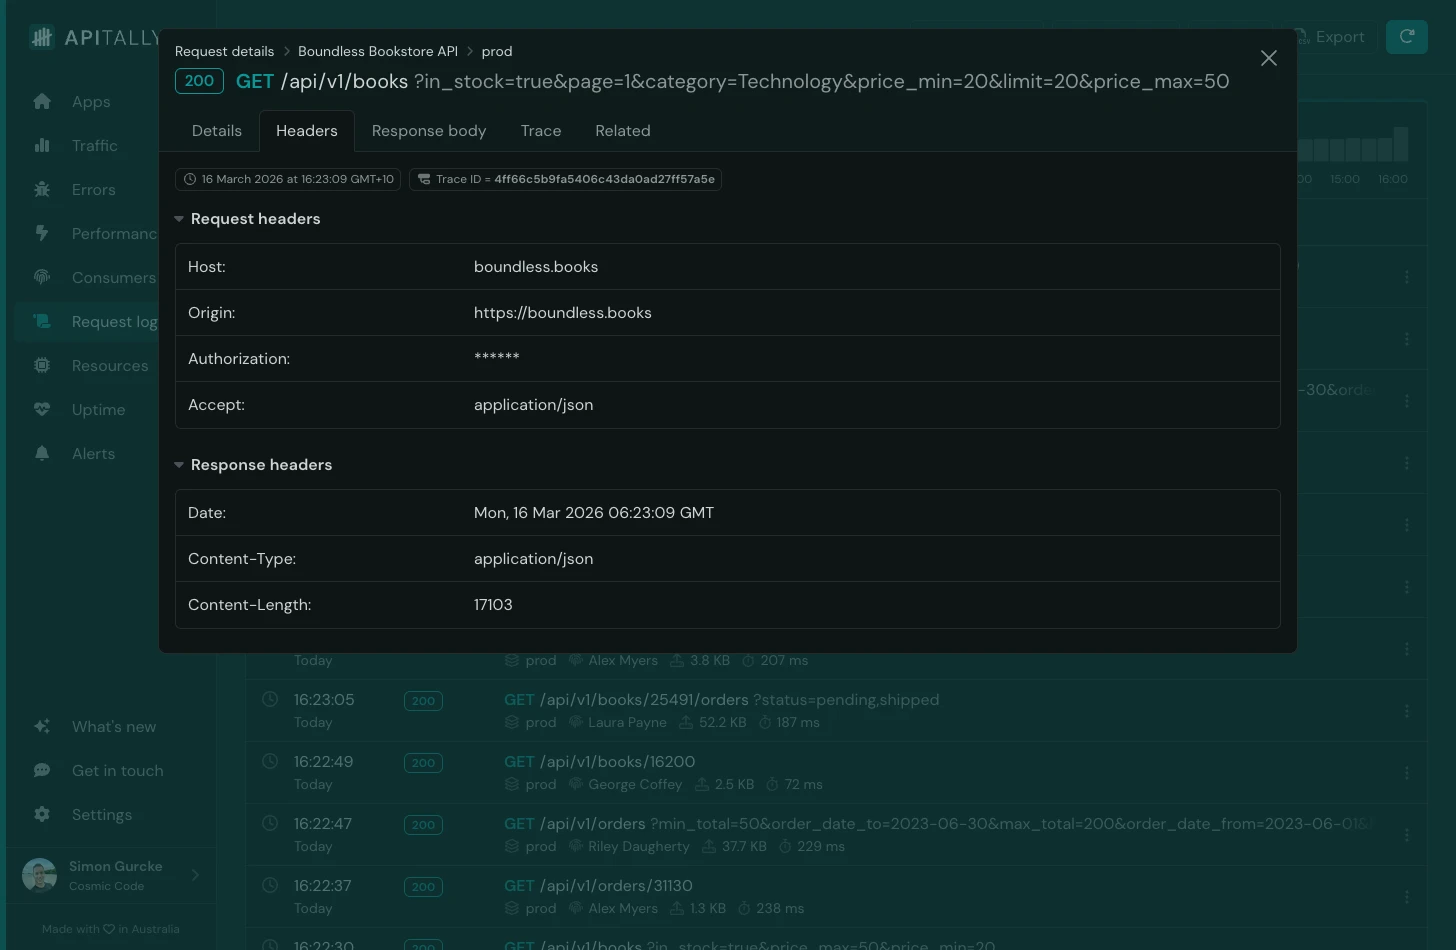
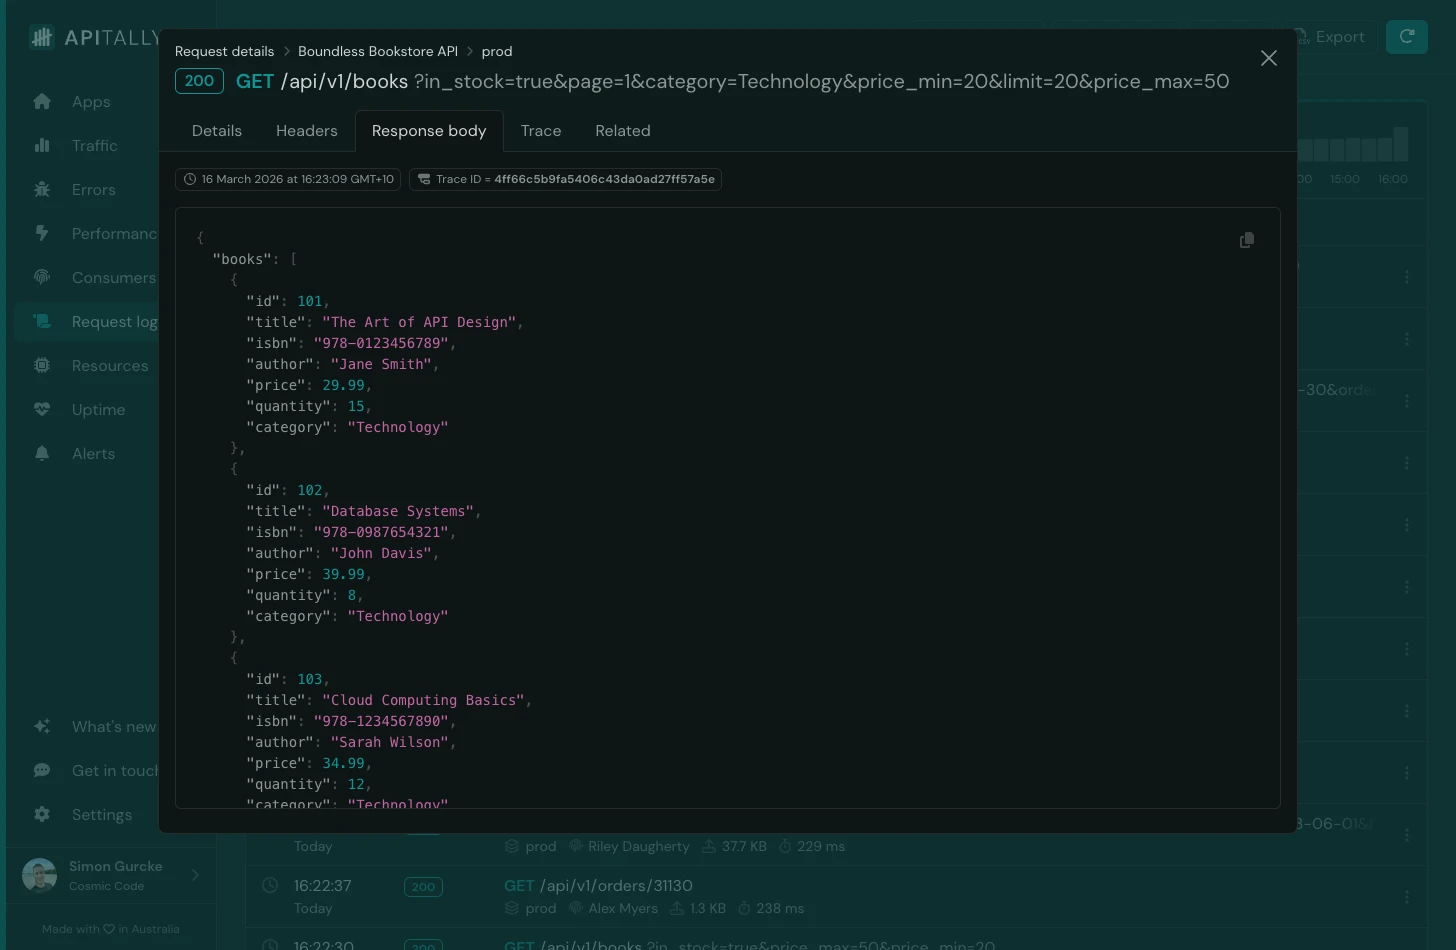
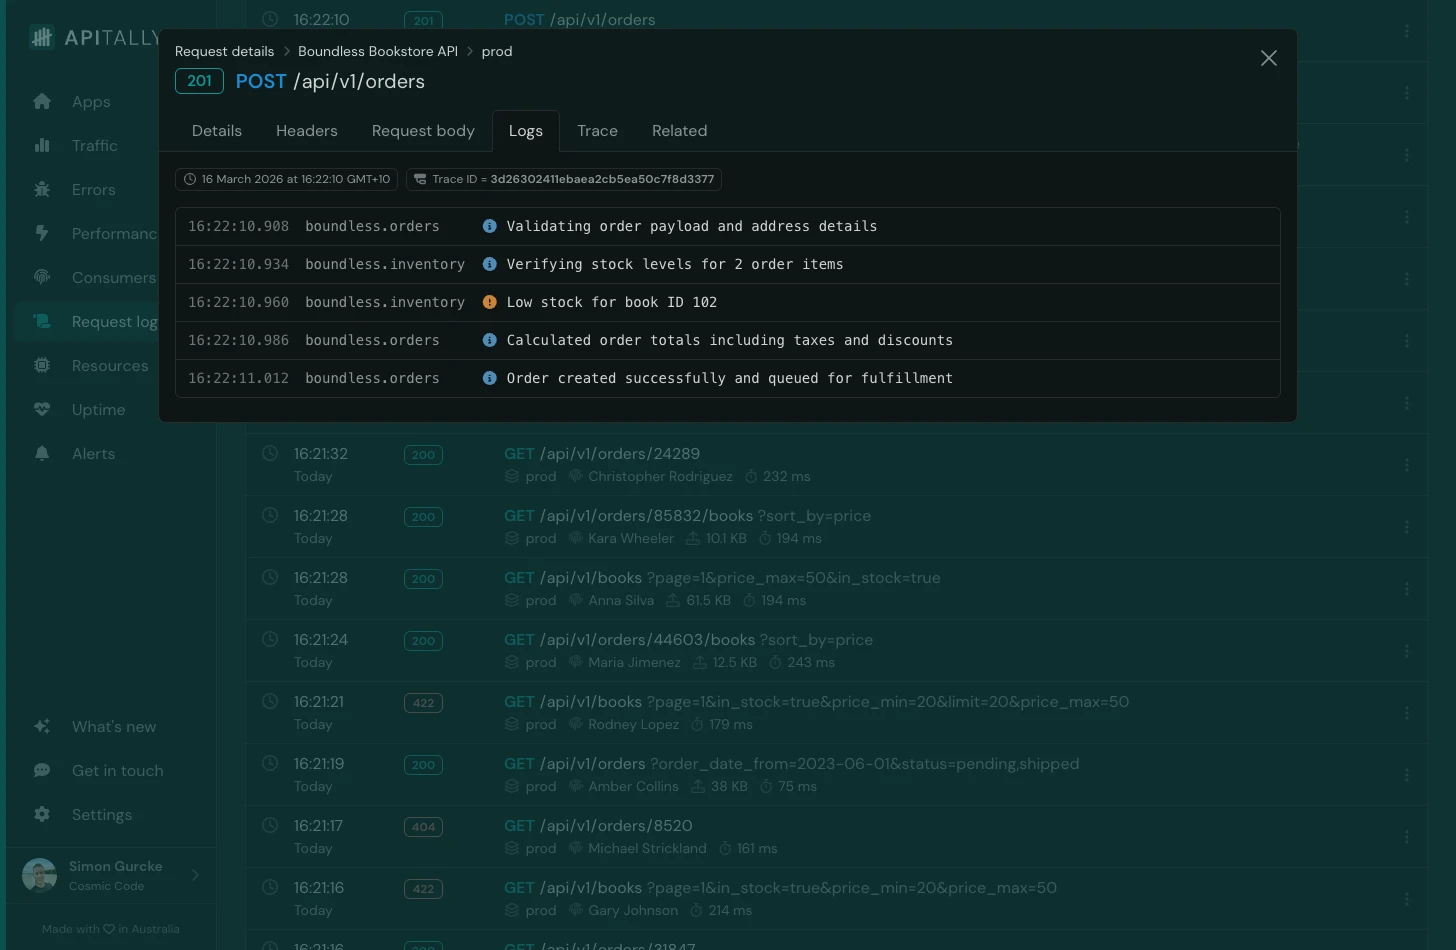
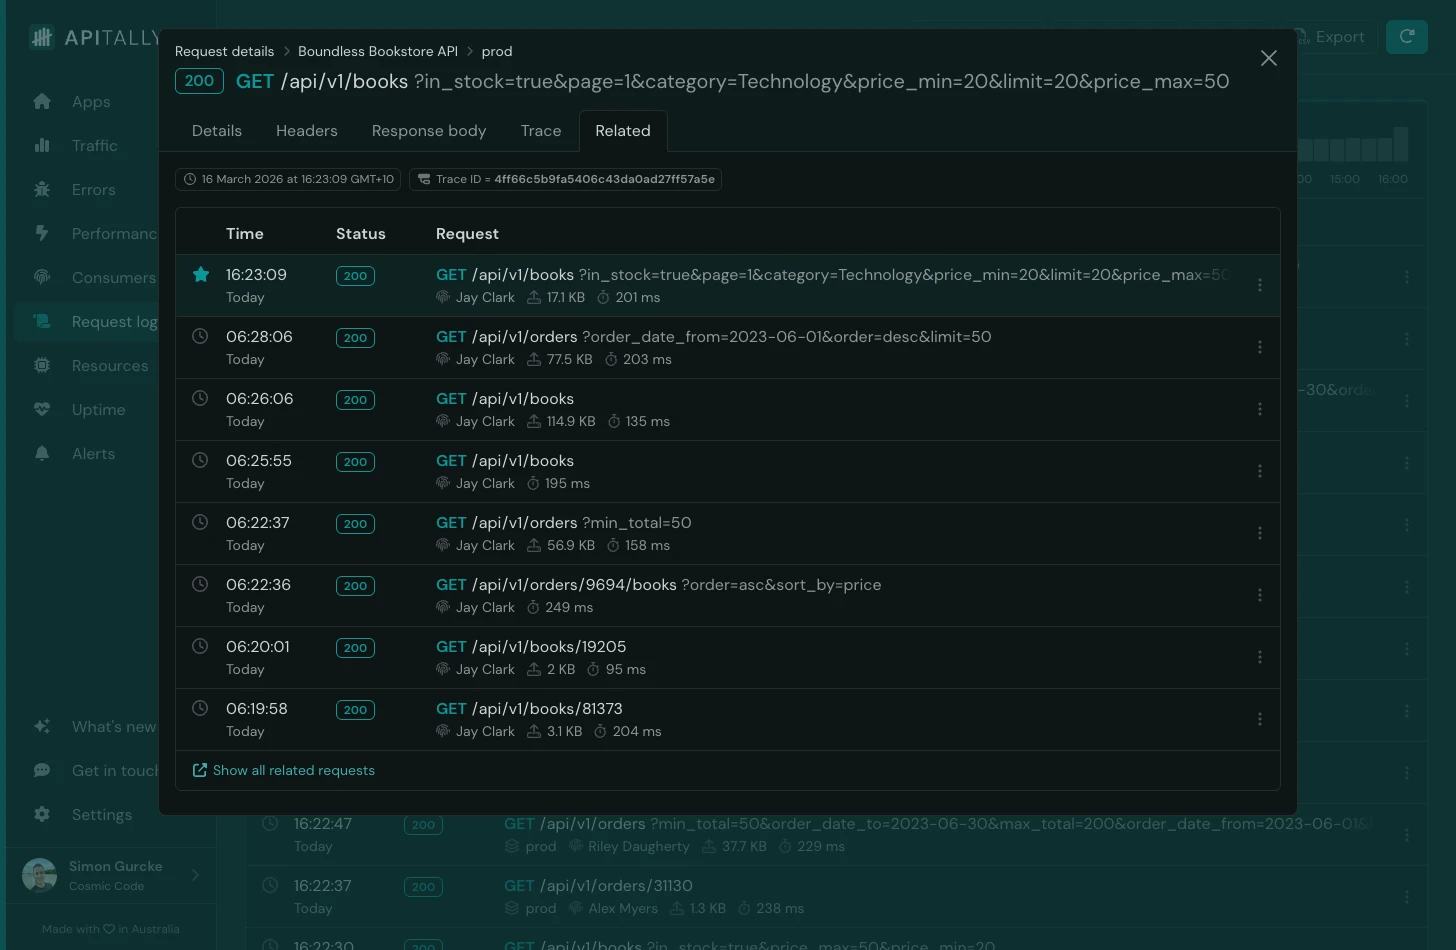
Clicking on a request in the logs shows rich details, including:
- Path and query parameters
- Headers (with sensitive headers masked automatically)
- Request and response bodies (supports text and JSON up to 50 KB)
- Correlated application logs and traces
- List of related requests from the same client
Apitally stores log data in a ClickHouse database hosted in the US and retains it for 15 days. Log volume limits apply based on the pricing tier, with the lowest tier allowing 1 million requests per month. The highest tier includes 25 million requests and users can enable usage-based pricing to go beyond that limit.
Check out the docs to learn more about request logs in Apitally, and the FastAPI setup guide for more details on configuration options, consumer tracking, and tracing.
Conclusion
Python’s standard logging module with a request logging middleware and correlation IDs covers the fundamentals for most FastAPI applications. For structured output, python-json-logger, structlog, and Loguru each offer a different trade-off between flexibility and simplicity. When you need full request and response visibility, Apitally captures that alongside your application logs and is ready for production with minimal effort and boilerplate code.